arrow_back_ios

Main Menu

See All Acoustic End-of-Line Test Systems See All DAQ and instruments See All Electroacoustics See All Software See All Transducers See All Vibration Testing Equipment See All Academy See All Resource Center See All Applications See All Industries See All Insights See All Services See All Support See All Our Business See All Our History See All Our Sustainability Commitment See All Global Presence
arrow_back_ios

Main Menu

See All Actuators See All Combustion Engines See All Durability See All eDrive See All Production Testing Sensors See All Transmission & Gearboxes See All Turbo Charger See All DAQ Systems See All High Precision and Calibration Systems See All Industrial electronics See All Power Analyser See All S&V Hand-held devices See All S&V Signal conditioner See All Test Solutions See All DAQ Software See All Drivers & API See All nCode - Durability and Fatigue Analysis See All ReliaSoft - Reliability Analysis and Management See All Test Data Management See All Utility See All Vibration Control See All Acoustic See All Current / voltage See All Displacement See All Load Cells See All Pressure See All Strain Gauges See All Torque See All Vibration See All LDS Shaker Systems See All Power Amplifiers See All Vibration Controllers See All Accessories for Vibration Testing Equipment See All Training Courses See All Whitepapers See All Acoustics See All Asset & Process Monitoring See All Custom Sensors See All Data Acquisition & Analysis See All Durability & Fatigue See All Electric Power Testing See All NVH See All Reliability See All Smart Sensors See All Vibration See All Weighing See All Automotive & Ground Transportation See All Calibration See All Installation, Maintenance & Repair See All Support Brüel & Kjær See All Release Notes See All Compliance See All Our People
arrow_back_ios

Main Menu

See All CANHEAD See All GenHS See All LAN-XI See All MGCplus See All Optical Interrogators See All QuantumX See All SomatXR See All Accessories See All Accessories See All BK Connect / Pulse See All API See All Microphone Sets See All Microphone Cartridges See All Acoustic Calibrators See All Special Microphones See All Microphone Pre-amplifiers See All Sound Sources See All Accessories for acoustic transducers See All Experimental testing See All Transducer Manufacturing (OEM) See All Accessories See All Non-rotating (calibration) See All Rotating See All CCLD (IEPE) accelerometers See All Charge Accelerometers See All Impulse hammers / impedance heads See All Cables See All Accessories See All Electroacoustics See All Noise Source Identification See All Environmental Noise See All Sound Power and Sound Pressure See All Noise Certification See All Industrial Process Control See All Structural Health Monitoring See All Electrical Devices Testing See All Electrical Systems Testing See All Grid Testing See All High-Voltage Testing See All Vibration Testing with Electrodynamic Shakers See All Structural Dynamics See All Machine Analysis and Diagnostics See All Calibration Services for Transducers See All Calibration Services for Handheld Instruments See All Calibration Services for Instruments & DAQ See All On-Site Calibration See All Resources See All Software License Management

[Please note that the following article — while it has been updated from our newsletter archives — may not reflect the latest software interface and plot graphics, but the original methodology and analysis steps remain applicable.]


Guest Submission - John J. Paschkewitz, P.E., CRE, Watlow

Introduction

Customers often require parts from suppliers to last a specified number of cycles in a use level operational profile with a certain confidence level. Verifying that a product can meet this requirement typically requires using accelerated life testing with time varying stress profiles. This article describes an effective method to verify the requirement with reasonable time and resources. It uses a combination of qualitative Accelerated Life Testing (ALT) methods, such as HALT or step-stress testing to find product limits and eliminate weaknesses, Calibrated Accelerated Life Testing (CALT) to determine life at accelerated profile levels and, finally, analysis in ReliaSoft ALTA PRO software to estimate cycles of life at use level stress in the application. CALT methods developed by Larry Edson provide a way to reduce test runs and test time with sequential quantitative ALT [1], [2].

Many products are exposed to time varying stress profiles in their use level application. This can complicate accelerated life testing and design verification of reliability. Test setup is more complex than constant stress levels and analysis of the test results becomes more complicated, but time varying stress profiles are more representative of the operating conditions for these products. The varying stress levels can lead to fatigue failures of many components.

Overview of the Method

Defining the expected use level profile is the first step. This can be done with the subsystem or OEM customer if you are a component supplier. Upper limits for each applied stress are determined next using HALT or step-stress testing. Capability to run a use level profile is confirmed in the test setup or prototype system/subsystem. Accelerated profiles are then determined based on the percentage decrease of the peak from the upper limit, and the rest of the profile is developed proportional to the use level profile. CALT methods are used to determine the first two accelerated profiles and the third is determined from the life-stress plot of results from these first two profiles. Life-stress plots are generated using the peak stress value in the time varying profile. Three to five samples are tested to failure at each accelerated profile and life analysis is completed using ALTA 7 PRO to determine whether the product can meet reliability requirements.

Summary of Accelerated Life Testing (ALT)

Accelerated Life Testing (ALT) is the application of key stresses at levels above the use level and below the upper limit for the product to determine failure modes and estimate product life. Acceleration can be either compressed operating time to eliminate non-operating periods, increased stress above normal use levels on the product, or both. There are numerous publications and seminars covering ALT methods.

In accepted practice for ALT, the first step is finding the product limits. This can be done with qualitative accelerated stress testing such as step-stress testing, HALT or limit testing appropriate for the product. The qualitative tests also provide a means to detect and eliminate design weaknesses and understand product failure modes.

For a reasonable life estimate extrapolation from quantitative ALT, at least three accelerated stress levels between application use level and the upper limit are selected. Test samples are allocated to these levels with more samples at the lowest stress level to provide a better extrapolation, as indicated in the work of Wayne Nelson and William Meeker. For example, you might allocate samples for the ALT in the ratio of 1:2:4 from highest to lowest stress level or 4:7:9 for 20 samples from highest to lowest stress. Samples are tested, recording the stress applied and the time to failure or suspension. If equipment is available, multiple levels can be run in parallel, but the larger number of samples at the lowest of the three accelerated levels typically drives total test time.

Illustration of the CALT Method

Calibrated Accelerated Life Testing (CALT) is a sequential method of quantitative ALT that can be used to reduce test time and sample size to arrive at a useful estimate of life. The graphical illustration in Figure 1 is a good way to visualize the CALT process. The x-axis is the stress level from use level to the upper limit for the product. The y-axis is life in cycles or time. The life requirement for the product is shown on the left vertical axis. Note this is a log-log plot, so it typically produces a straight line life vs. stress relationship. The process starts at the upper limit found in previous testing. The upper limit becomes the foolish stress level where the product fails very quickly. From there, we select our first stress level at 10-15% below the upper limit and then run two samples to failure at this stress. Then we select the second stress level 10-15% below the first stress level. Again we run two samples to failure. We now have two points and can establish a preliminary life-stress line. With this line, we can select the third stress level where remaining available test time intersects the life-stress line. Two, or preferably more, samples are run to failure at the third level. If available, additional samples at each level will improve the life extrapolation, so the 2-2-3 sample distribution represents a minimum [1].


Figure 1: CALT process illustration

CALT Concept with Time Varying Stress Profiles

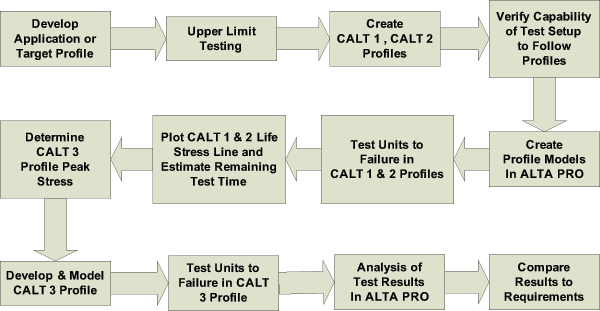
As originally presented, the CALT process was based on constant stress levels similar to the most common ALT method. However, the same basic methodology can be adapted to time varying stress profiles. We still start with the upper limit for the selected stress that the product sees in the application (e.g., temperature, voltage, power, etc). The difference is that we use the peak stress level in the time varying profile as the reference point. The peak stress level for the first ALT profile is set 10-15% below the upper limit. The remainder of the profile is created in proportion to the use level profile using a percentage offset from the peak for each segment end point. This is similar to CALT with constant stresses, except we are using the profile peak values. Figure 2 provides a process flow chart to provide an overview of the method being detailed in this article.


Figure 2: CALT process with time varying stress profiles

Application Stress Profiles

Plotting the segments of the operational use level profile is the first step in using time varying stress profiles. The customer, such as a system OEM, might have this information or the designer may be able to provide the expected stress levels and durations. Be sure to consider typical use case and severe use cases. Often, these are unique to a particular product or installation. However, they can be typical for a particular industry or target application if used for a standard product rather than a product that is unique for the customer.

The next step is to determine which stresses most affect life and can be used in an accelerated life test. Plotting the stress vs. time profile is helpful in breaking it into segments for modeling, visualizing peak stresses and accelerating segments in proportion to the accelerated peak stress.

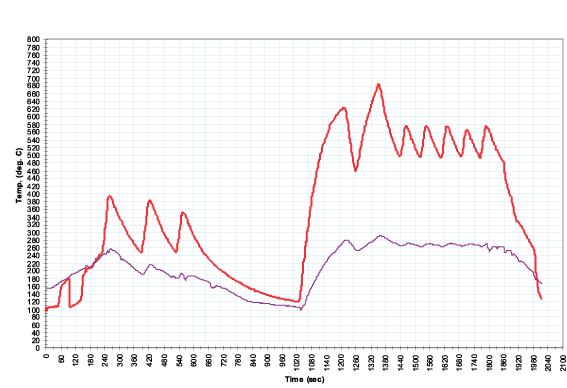
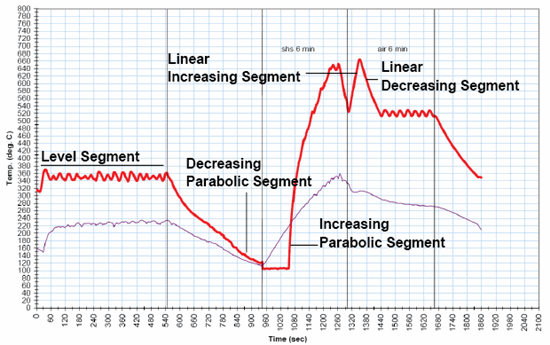
The next consideration is control of the test and the ability of the test setup and equipment to follow the use level and accelerated profiles. Figure 3 illustrates an example time varying stress profile for an application of a tubular electric heater. This example profile shows the temperature at the heater sheath in red (upper trace) and the resultant temperature of the heated fluid in purple (lower trace). This was obtained from the system OEM. Temperature is on the y-axis and time is on the x-axis. The profile represents operation in a heat exchanger in the customer’s system. It also illustrates why using constant stress ALT or simplified cycles are not representative of the stress applied in the application. This type of information from a customer or system designer facilitates development of the test profiles.

Figure 3: Example of a time varying stress profile


Legacy constant stress testing of heaters has shown that element wire oxidation rate is one of the primary failure mechanisms for electric heaters, and this rate increases exponentially with temperature. The peaks in a profile like this have a much greater effect on heater life than extended durations at lower or typical operating levels. The changes in temperature in such a profile also produce expansion and contraction leading to fatigue and open circuit failures.

When selecting a stress and profile for testing, an understanding of the physics of failure for a product and application environment is essential.

Upper Limit Testing

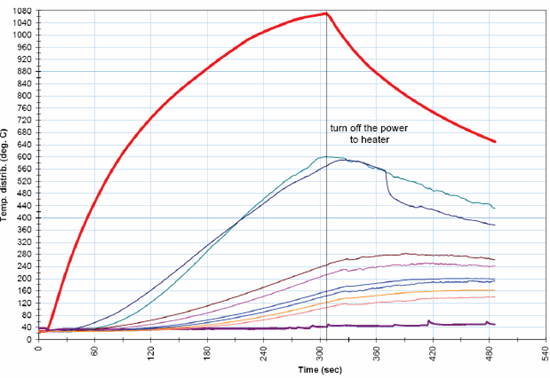
Figure 4 shows the upper temperature limit of the heater installed in the application system. Temperatures at the heater and other points in the heat exchanger assembly were recorded as shown in this temperature vs. time plot. The sheath temperature of the heater was measured with a thermocouple and the heater element failed with an open circuit at the upper limit. Since this test was run in the customer system, other limitations of the system also had to be considered in planning the test stress levels. The test is repeated at least two or three times to check variability among test samples.


Figure 4: Upper limit testing of the heater

Example of ALT with Time Varying Profiles

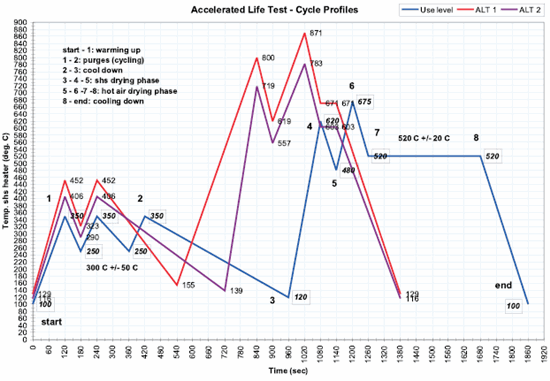
After the upper limit has been determined, the process to determine ALT profiles can be illustrated in the plot shown in Figure 5. Again we start with the peak stress point on the ALT 1 profile at 10-15% below the upper limit. Then we determine the percentage difference between the ALT 1 peak and the use level peak. The end points for each segment in the ALT 1 profile are then calculated by the same percentage above the corresponding use level profile point. When this is completed, the ALT 1 profile can be plotted. Similarly, for the ALT 2 and ALT 3 profiles, the segment end points are calculated from the peak stress level using 10-15% below the peak for ALT 1 to determine the peak for ALT 2. The appropriate percentage difference is applied to determine the remaining segment points for the ALT 2 profile. Figure 5 shows the relationship of use level and accelerated stress profiles for test planning.


Figure 5: Use level and accelerated stress profiles

In this example, we started with a 1058 C upper limit. Reducing that by 17%, we used 871 C as the peak for the ALT 1 profile. This is 196 C or 22.5% above the use level profile peak temperature. We use 22.5% above each of the corresponding use level profile points to determine the ALT 1 profile. A similar procedure is used for the ALT 2 profile. The procedure for selecting the ALT 3 level peak for CALT will be described later in this article.

Verify the test profile in the test rig to make sure the setup can follow the calculated profile. Adjust the profile points to reflect what actually occurs in the test setup. Note that the time duration of the accelerated profiles is also shorter than the use level profile. This was done to provide additional acceleration and due to the operation of the system during trial runs of the accelerated profiles.

Creating Time Varying Profiles in ALTA PRO

The next step is to model these time varying profiles in ReliaSoft ALTA PRO software so that the results can be analyzed and used to extrapolate a life estimate. Equations need to be written for each segment defining the stress as a function of time.

The start and stop times for the segments are identified first. Then the type of segment is identified. Most segments are level, linear (increasing or decreasing) or parabolic (increasing or decreasing). Using the standard equation for each of these segment types and the end point values, the equations to model the profile in ALTA PRO can be derived. Figure 6 shows a stress profile that illustrates most of the typical segments and shows how a profile can be broken into linear and parabolic segments for modeling the profile.


Figure 6: Example of profile segments

Equations for Linear Profile Segments

Increasing Linear Segment: y = S1 + (t - t1)x

Decreasing Linear Segment: y = S1 + (t1-t)x

For these equations, identify the end points of the segments by the start point values for stress and time, (S1,t1); then the end point values for stress and time, (y,t). Solve for x, then rewrite the equation for S as a function of time.

Equations for Parabolic Profile Segments

Similarly, one method to determine equations for parabolic segments is shown here. It assumes a vertex for the parabola from the segment in the profile. Select the equation form for the orientation of the parabola. Once the basic segment is modeled, it may require some trial and error adjustment of terms to get proper connection with adjacent segments in the profile. This is due to the need to assume a vertex point for the parabola. The method is:

Assume vertex point for parabola. The vertex is defined by and k in this equation: y=a(x-h)2+k

With a vertical axis of symmetry, if a > 0, parabola opens upward. If a < 0, parabola opens downward. With a horizontal axis of symmetry, the equation is x = a(y-k)2 + h. If a > 0, parabola opens right. If a < 0, parabola opens left.

Insert segment start point values (x,y), then solve for the scale parameter, a. Insert values of ah, and k to provide S as a function of time. This results in the following equation:

t1 = a(S1-k)2 + h or S = SQRT[(t-h)/a] + k

An alternative method to define parabolic segments is described in a helpful article in the Reliability HotWire on ReliaSoft’s weibull.com website [3]. It uses the non-linear equation solver tool in the Weibull++ software to obtain parabolic segment equations. The same article describes a method for exponential segments as well, using the Weibull++ degradation analysis tool.

Entering Profile Segment Equations into ALTA PRO

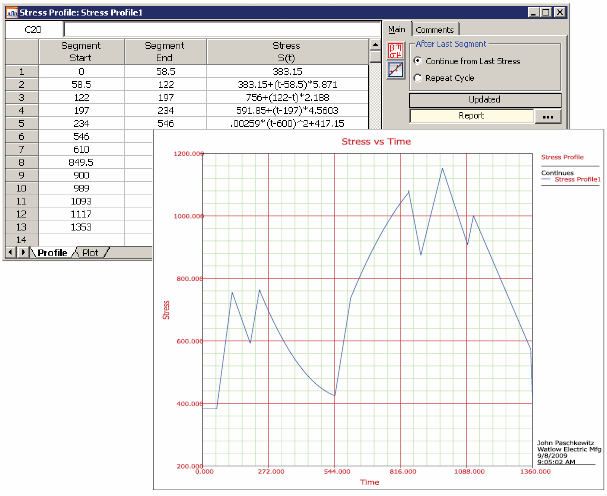
Using the methods just described, we can model the profiles in ALTA PRO using a Stress Profile Folio. Figure 7 shows an example of the equation entry. The steps are:


  1. Determine segment end points as stress and time.
  2. Develop equations to model the stress profiles.
  3. Select "Continue from Last Stress" in the ALTA PRO Stress Profile Folio to create a single cycle of the profile for evaluation.


Figure 7: Modeling the stress profile in ALTA PRO


The plot in Figure 8 illustrates the confirmation of a single cycle of the profile modeled above. This can be used to verify the profile has been modeled correctly and can be used to run a trial profile in the test setup. After verifying the correct profile, be sure to select "Repeat Cycle" in the Stress Profile Folio before running the analysis on the results.


Figure 8: Using peak stress values to determine ALT 3 peak

Determination of CALT Third Level Profile

Recall how we determined the stress level for ALT 3 in a constant stress CALT using the preliminary life-stress line and available test time. For a time varying stress profile, the process is similar. However, the cumulative damage model does not provide a life vs. stress plot to help determine the third ALT level from remaining available test time. Calculating a life vs. stress plot for time varying stresses would be a lengthy and difficult calculation.

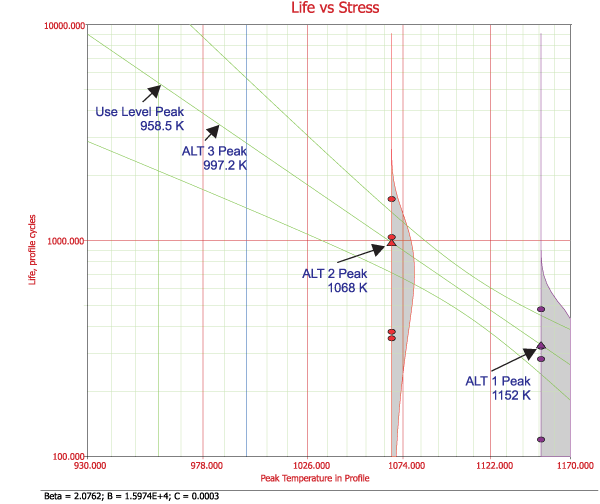
An alternative method to determine the ALT 3 level is shown in Figure 8. After running the ALT 1 and ALT 2 samples and getting cycles to failure in each profile, we enter the cycles to failure and the peak stress in each profile into a supplemental analysis Folio and create a life-stress plot based on the peak of each profile. We use that plot to determine a peak stress for ALT 3. Then we create the ALT 3 profile in proportion similar to what was done for ALT 1 and ALT 2 profiles. The steps are:


  • ALT 1 Peak is 10-15% Below Upper Limit
  • ALT 2 Peak is 10-15% Below ALT 1
  • The Peak for the ALT 3 Profile is determined from ALT 1 and ALT 2 Results
  • Enter times to failure for ALT 1 and ALT 2 into a new Folio in ALTA PRO.
  • Enter the corresponding peak stress levels.
  • Run the preliminary analysis in ALTA PRO.
  • Plot the life-stress line for peak stress values.
  • Use the plot to determine ALT 3 peak stress.
  • Develop the ALT 3 profile proportionally.
  • After determining the ALT 3 peak:
    • Develop the ALT 3 profile segments with the segment end points proportional to the use level profile with percentage difference from peak value.
    • Model the ALT 3 profile as a function of time in ALTA PRO.
    • Plot and verify the ALT 3 profile.
    • Confirm the capability to follow the profile with the test setup.

Analysis with Stress Profiles in ALTA PRO

After running samples to failure with all three accelerated stress profiles, we can run the analysis in ALTA PRO to extrapolate an estimated life in cycles of the use level profile.


  • Time varying stress profiles require use of the cumulative damage model. Previously developed ALT profiles and use level profile are selected as stress levels.
  • Enter cycles of profile to failure for each sample, unit identification and failure mode.
  • Select the appropriate stress transformation.
  • Use the Wizard to select a distribution for the data.
  • Run and plot the analysis.
  • Evaluate the results – Do they make sense?

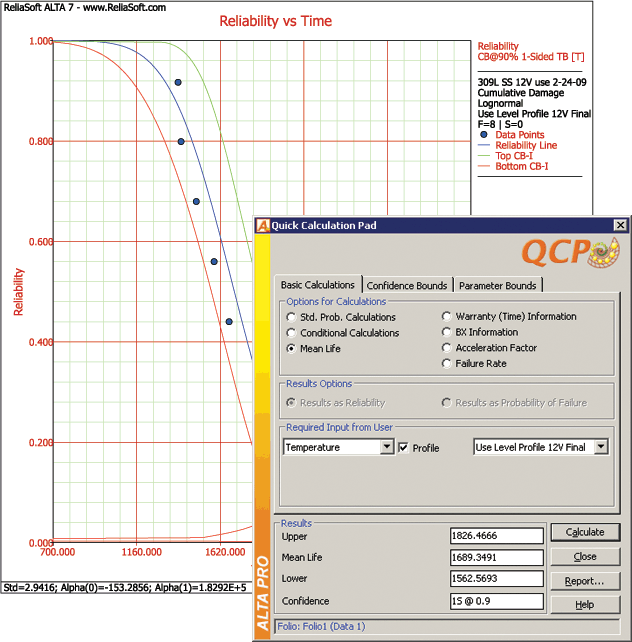
Using the Quick Calculation Pad (QCP) in ALTA PRO, the mean life, reliability and other calculations can be run and confidence bounds selected, as shown in Figure 9. These can be used to compare the test results to the life requirements for the product being tested in order to verify meeting the requirement. The life results will be in cycles of the time varying stress profile at the use level in the application.


Figure 9: Mean life calculation and reliability vs. cycles plot


The cumulative damage model enables several plots to help evaluate the test results. Figure 9 shows the reliability vs. time (cycles) plot and confidence bounds. Other plotting options include reliability and unreliability vs. time, failure rate vs. time, probability density function and residuals.

Summary

This article has summarized how Calibrated Accelerated Life Testing methods and time varying stress profile analysis can be combined to effectively verify product life requirements in terms of operating cycles at use level stresses in the application. This approach reduces the time and resources needed for life testing of products subjected to more complex stress profiles.

The method works best for specific customer products where the application profile is well defined. But it also is useful when a typical or worst case profile can be defined for a standard product in broader application.

Limitations

The primary limitation of the CALT method is the small number of samples used for testing. This inherently affects the statistical rigor of the results and produces some risk in assessing the variability in life among samples. As such, it represents a compromise. But in today’s real world of compressed product development schedules and cost constraints, the method provides a useful means to estimate product reliability within those resource constraints.

References

[1] Larry Edson, Seminar: Demonstrating Reliability Requirements with Accelerated Testing. (Offered by Hobbs Engineering, http://www.hobbsengr.com.)

[2] GMW8758, Calibrated Accelerated Life Testing, October 1, 2004. (Available from IHS Automotive, http://auto.ihs.com.)

[3] ReliaSoft, "How to Define a Complicated Stress Profile," Reliability HotWire, Issue 87, May 2008. http://www.weibull.com/hotwire/issue87/hottopics87.htm

About our author

John Paschkewitz is currently working as a Principal Engineer at Watlow, which he joined in 2004. He holds a B.S. in Mechanical Engineering and a Masters in Engineering Professional Development from the University of Wisconsin – Madison and a M.A. in Business Management from Central Michigan University. He is a registered Professional Engineer and an ASQ Certified Reliability Engineer. He has 34 years experience in product assurance, testing and reliability in several industries. He can be reached at [email protected] for additional information.