arrow_back_ios

Main Menu

See All Acoustic End-of-Line Test Systems See All DAQ and instruments See All Electroacoustics See All Software See All Transducers See All Vibration Testing Equipment See All Academy See All Resource Center See All Applications See All Industries See All Insights See All Services See All Support See All Our Business See All Our History See All Our Sustainability Commitment See All Global Presence
arrow_back_ios

Main Menu

See All Actuators See All Combustion Engines See All Durability See All eDrive See All Production Testing Sensors See All Transmission & Gearboxes See All Turbo Charger See All DAQ Systems See All High Precision and Calibration Systems See All Industrial electronics See All Power Analyser See All S&V Hand-held devices See All S&V Signal conditioner See All Test Solutions See All DAQ Software See All Drivers & API See All nCode - Durability and Fatigue Analysis See All ReliaSoft - Reliability Analysis and Management See All Test Data Management See All Utility See All Vibration Control See All Acoustic See All Current / voltage See All Displacement See All Load Cells See All Pressure See All Strain Gauges See All Torque See All Vibration See All LDS Shaker Systems See All Power Amplifiers See All Vibration Controllers See All Accessories for Vibration Testing Equipment See All Training Courses See All Articles See All Acoustics See All Asset & Process Monitoring See All Custom Sensors See All Data Acquisition & Analysis See All Durability & Fatigue See All Electric Power Testing See All NVH See All Reliability See All Smart Sensors See All Vibration See All Weighing See All Automotive & Ground Transportation See All Calibration See All Installation, Maintenance & Repair See All Support Brüel & Kjær See All Release Notes See All Compliance See All Our People
arrow_back_ios

Main Menu

See All CANHEAD See All GenHS See All LAN-XI See All MGCplus See All Optical Interrogators See All QuantumX See All SomatXR See All Accessories See All BK Connect / Pulse See All API See All Microphone Sets See All Microphone Cartridges See All Acoustic Calibrators See All Special Microphones See All Microphone Pre-amplifiers See All Sound Sources See All Accessories for acoustic transducers See All Experimental testing See All Transducer Manufacturing (OEM) See All Accessories See All Non-rotating (calibration) See All Rotating See All CCLD (IEPE) accelerometers See All Charge Accelerometers See All Impulse hammers / impedance heads See All Cables See All Accessories See All Electroacoustics See All Noise Source Identification See All Environmental Noise See All Sound Power and Sound Pressure See All Noise Certification See All Industrial Process Control See All Structural Health Monitoring See All Electrical Devices Testing See All Electrical Systems Testing See All Grid Testing See All High-Voltage Testing See All Vibration Testing with Electrodynamic Shakers See All Structural Dynamics See All Machine Analysis and Diagnostics See All Calibration Services for Transducers See All Calibration Services for Handheld Instruments See All Calibration Services for Instruments & DAQ See All On-Site Calibration See All Resources See All Software License Management
null

Measurement Uncertainty: Less Errors, Better Results

Strain gauge technology with its ample opportunities for error compensation has been optimized for decades. And yet there are influences that may affect strain gauge measurements.

The aim of this article is to point out the many (often avoidable) sources of error when strain gauges are used in experimental stress analysis and to provide assistance so that measurement uncertainty can be assessed already in the design stage.

Fundamental questions on your measurement setup

The following observations that may be useful prior to taking strain gauge measurements in experimental stress analysis are to summarize the authors' experiences. The following questions are essential to the required measures (e.g. measuring point protection) and the measurement uncertainty that can be obtained:

  • When will the measuring point reach the end of its useful life?
  • How high will the strain values be?
  • Will there be any temperature variation? If yes, how great and how fast?
  • Will special environmental influences (water, humidity, etc.) affect the measuring point?
  • What material is the strain gauge being installed on (inhomogeneous, anisotropic, highly hygroscopic, etc.)?
  • Is there any possibility to readjust the zero point, if necessary?

The experienced test engineer will be looking for the answers already when analyzing the measurement task (long before the first strain gauge is being installed). The answer to the last question decides whether the measurement is

  • zero-point related or
  • non zero-point related.

Zero-point related measurements

Zero-point related measurements are generally understood as measurements involving comparison of current measured values with measured values obtained at the start of measurement over several weeks, months or even years. No "zero balancing" of the measurement chain is performed in the meantime.

Zero-point related measurements are far more critical than non zero-point related measurements, because zero drifts (resulting from temperature and other environmental influences) are fully incorporated into the result of measurement. Zero errors are particularly dangerous with small strain values, because this results in very large relative deviations related to the measured value.

Strains occurring in machine components and structures often do not even amount to 100 µm/m, because a high safety factor is "built in". 100 µm/m zero drift, in this case, results in 100 % measurement error. Due to the fact that a continuous measurement for structural monitoring is almost always a zero-point related measurement, special attention needs to be paid to protecting the strain gauges from environmental influences. It is essential that the measuring point offers sufficient long-term stability.

Since large temperature variations have to be expected, the temperature coefficients need to be small. Low measurement signal amplitudes at generously dimensioned components are likely to be superimposed by effects resulting from deficient strain gauge installation. The measurement electronics responds to every change in resistance with a change on its display. This may be due to the change in the quantity to be measured or, also, the ingress of water molecules. The actual measured value, as the aggregate signal of all strain proportions at the strain gauge, does not allow a distinction to be made between wanted and unwanted strain proportions.

Non zero-point related measurements

Non zero-point related measurements are understood as measurement tasks that allow zero balancing without any information loss at specific points in time. Only the variation of the measured quantity after "zero balancing" is relevant.  (Modern bathroom scales are automatically tared every time they are switched on, without any loss of information.)

"Zero balancing" is often possible with one-off load tests (often in the form of short-term measurements), hence zero drifts are totally insignificant. Very high strains occur in destructive tests, which means that strain gauges with adequate measuring ranges are required. It is embarrassing and costly when after weeks of preparatory work it becomes obvious that the strain gauges installed at the component have failed. Measurements in laboratories and test halls are considered rather uncritical, because the ambient conditions (temperature, humidity) are moderate. Measurements in the field and in environmental chambers with high humidity and large temperature gradients, however, are critical.

The components of the measuring chain

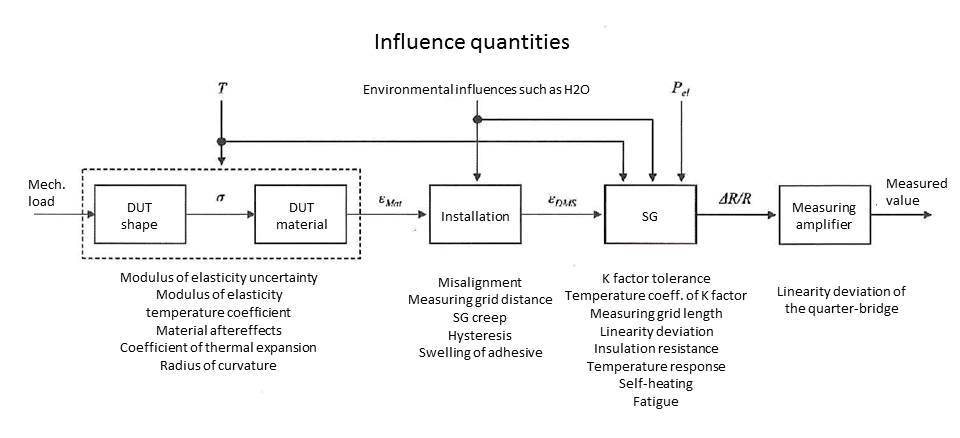
For purposes of clarity and comprehensibility, only the uniaxial stress state will be considered below. The block diagram (Fig. 1) shows the flow of the measurement signal. It also shows the influence quantities and their effect in correlation with the important features of the measurement chain. These features and effects are shown in blue if they can affect the zero point.

null

Index of formulas

null

The measurement object (DUT)

When the measurement object under examination is loaded, the stress σ is exerted in the material. This causes a strain in the material which behaves inversely proportionally to the modulus of elasticity. This material strain can be determined as a surface strain by means of a strain gauge. The modulus of elasticity exhibits an uncertainty (tolerance of the modulus of elasticity). Extensive examinations on structural steels have shown a variation coefficient of 4.5%.

The modulus of elasticity also depends on temperature as an influence quantity and the temperature coefficient of the modulus of elasticity. If the strain gauge is glued to a surface (such as a bending rod) that is extended convexly, the strain on the measuring grid is greater than on the surface of the component.

The reason for this has to do with the distance from the neutral fiber: The further the measuring grid is from this neutral fiber and the thinner the component, the stronger the measured value becomes. Smaller roles are played by the thickness of the adhesive and the structure of the strain gauge.

The change in temperature (∆t) acting together with the temperature coefficient of expansion of the material also causes thermal expansion, which is significant for zero-point related measurements. Elastic after-effects (caused by relaxation processes in the microstructure of the material) cause the strain of the material to diminish somewhat after spontaneous loading. The formula in the chart exhibits several uncertainties.

The installation of strain gauge

The required input quantity is the material strain. In an ideal case, it is identical to the actual strain of the measuring grid on the strain gauge: In actual practice, however, alignment and other installation errors occur despite great care. The strain gauge, as a spring element subject to mechanical stress, creeps back along its outer edge areas after spontaneous strain due to the strain loading and also depending on the rheological properties of the adhesive and the strain gauge carrier. It also exhibits a slight hysteresis the effect of the strain gauge creeping back is used in transducer construction to minimize material after-effects, which produce an undesirable additional strain, by adjusting the lengths of the transverse bridges not sensitive to strain on the strain gauge.

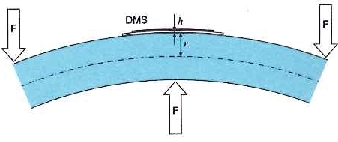
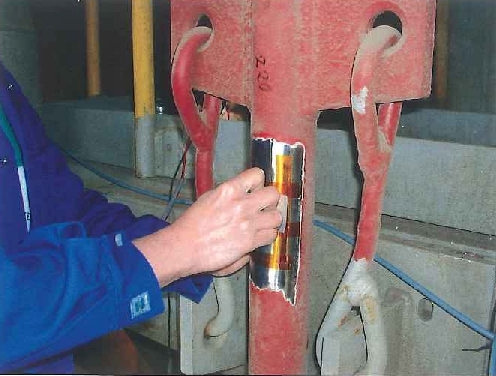
This compensation can only be implemented in experimental stress analysis with a great deal of effort. Increased strain may also occur due to a curved installation surface (see image). If measuring points are not adequately protected against humidity and moisture, the adhesive and carrier may soak up moisture and swell. This will be expressed as an error fraction in the form of an unintended task-specific strain in the strain gauges. Moisture content also affects the stability of the measured values as in all methods of measurement (see below strain gauge: insulation resistance). Especially with zero-point related measurements, a test engineer may be uncertain whether he/she is observing the relevant material strain or whether it is simply one of the other effects described above. Because of this, measuring point protection is an essential precondition for reliable results, especially with zero-point related measurements. This produces the effect that the strain of the measuring grid does not exactly match the material strain in the stress direction.

The strain gauge

The strain gauge converts the strain in the measuring grid into a relative change in resistance proportional to the strain. The tolerance of the K factor and its temperature sensitivity contribute to the uncertainty. It should be noted that if the strain is not distributed homogeneously, the average of the strain under the measuring grid is converted into the relative change in resistance. As a result of this, if the wrong active length of the strain gauge is chosen, the values measured for strain and material stress will be too small or too large. This is especially important when determining the maximum values of the mechanical stress peaks metrologically. The temperature response of the strain gauge affects the zero point. It has an impact with large temperature differences and especially with strain gauges that are poorly adapted to the thermal expansion coefficient of the material (DUT), since they interfere with the action of the compensation effects.

Self-heating (due to electrical power transformed in the strain gauge) has a similar result, as it leads to a temperature difference between the material and the strain gauge. This is the reason why it is possible to set very low excitation voltages on modern measuring amplifiers. Even small bridge output voltages can be accurately amplified by the devices. Caution is advised, however, with thin materials and materials that dissipate heat poorly. In the case of frequent alternating strain with a large amplitude (> 1500 µm/m) fatigue may occur in the measuring grid material, resulting in a zero drift. A transverse sensitivity of the strain gauge is present, but it does not produce any significant deviations. In the uniaxial stress state the transverse sensitivity is taken into consideration by the experimental determination of the K factor due to the way the factor is defined. A linearity deviation of up to 1000 µm/m is negligible for strains. Penetration of moisture and humidity reduces the insulation resistances, which in turn causes a resistance shunt to the connections of the strain gauge and is generally reflected by instability in the display of measured values. Low-ohm strain gauges are less sensitive to the influence of moisture and humidity.
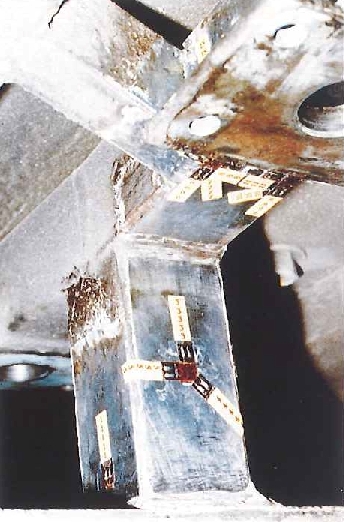
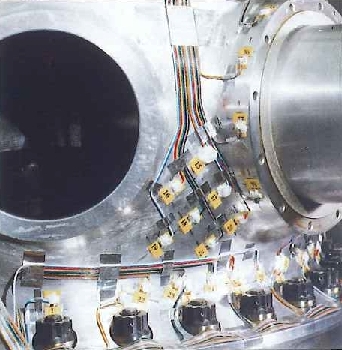
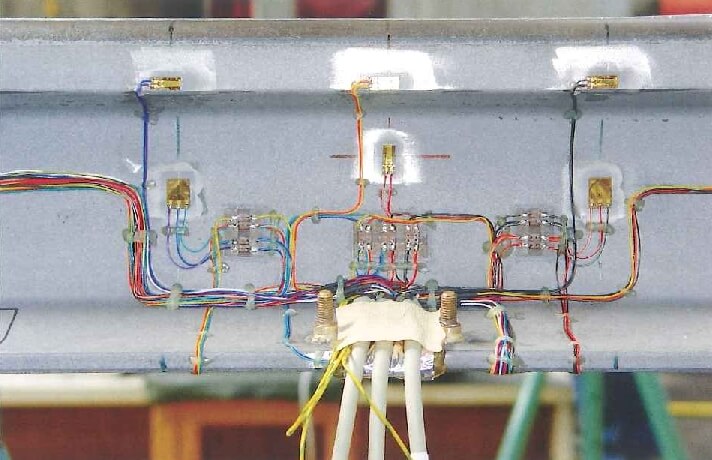
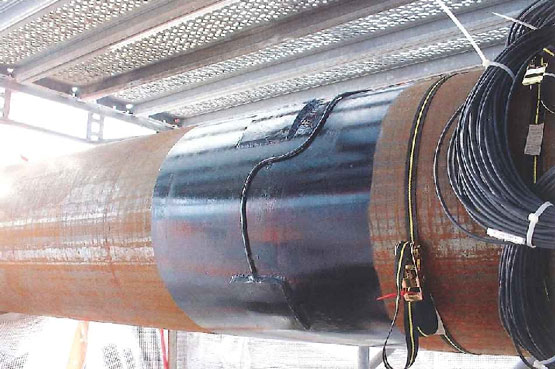
null
nullnull

The data acquisition unit

The input quantity into the measuring amplifier is the relative change in resistance of the strain gauge. Since it is very small (at 1000 µm/m and with a K factor of 2 it is just 0.2 % or 0.24 Ω out of 120 Ω), there is an addition to the Wheatstone bridge (quarter bridge circuit) in the experimental stress analysis by means of three fixed resistors (usually in the measuring amplifier). The advantages of half- and full-bridge circuits and ways to use them to reduce measurement uncertainties will not be dealt with here. The connection of a single strain gauge in a quarter bridge circuit is considered here. Usually the correlation between bridge unbalance and relative change in resistance is described with.

The actual correlation exhibits a small degree of non-linearity, which will be examined in greater detail below. The measuring amplifier supplies voltage to the bridge circuit, amplifies the bridge output voltage and generates the measured value. Deliberately left out of consideration here are measurement errors that can occur due to long supply lead resistances, interference fields, thermoelectric voltages and the measurement electronics themselves. These can be almost entirely avoided by using well-known technologies (multiwire techniques, extended Kreuzer circuits, shielding designs, modern TF measuring amplifiers).

Tolerance of the modulus of elasticity

The modulus of elasticity (manufacturer specification) exhibits an uncertainty (tolerance of the modulus of elasticity) which may be several percent. Accurately determining the modulus of elasticity in a suitable laboratory is costly and often cannot be implemented. In experimental stress measurements, or as we sometimes refer to it as experimental stress analysis (ESA), the relative uncertainty of the modulus of elasticity produces a relative uncertainty in the mechanical stress of the same amount. This means that if the material has a modulus of elasticity with a value known within an uncertainty of 5%, that alone produces an uncertainty of 5% in the stated mechanical stress.
The modulus of elasticity also depends on temperature as an influence quantity and the temperature coefficient (TC) of the modulus of elasticity (for steel ≈ -2 • 10^-4/K). The relative change in the modulus of elasticity is derived from the product: This is equivalent to the additional uncertainty of the mechanical stress. Example: If the modulus of elasticity of steel is given for a temperature of 23 °C and the measurement is performed at 33 °C, the modulus of elasticity drops by 0.2%. If this effect is not compensated for by computations, there will be a deviation of 0.2% in addition to the tolerance specified for the modulus of elasticity. Note that the TC of the modulus of elasticity is itself temperature-dependent, which means that this effect can never be entirely compensated for.
nullnullnull
Index of formulas

Estimating measurement uncertainty for non-zero-point related measurements

An important element of this measurement procedure is that the zero point for analyzing the measurement results is unnecessary. That is because only changes in the measured quantity are of interest and the zero point does not drift during the measurement (typical for relatively short measurement tests). Examples are crash tests, tensile tests and brief loading tests. Material after-effects and strain gauge creep can be somewhat important in non-zero-point related measurements and are therefore covered in this section.

On the other hand, phenomena such as thermal expansion, swelling of the adhesive, falling insulation resistance, temperature response of the strain gauge and strain gauge fatigue in non zero-point related measurements are almost completely irrelevant. Of course, resistance will not drop so dramatically during a brief loading test of insulation resistance that failure of the measuring point would be possible.

Radius for measurement objects subject to bending loads (increase in strain)

null

If the strain gauge is located on a component that bends longitudinally to the measuring grid, the strain of the measuring grid deviates from the surface strain of the component (Fig. 2). The measured values obtained are too large. The smaller the radius of curvature and the greater the distance of the measuring grid from the component surface, the greater the effect. If the strain gauge is located in the concave area, the measured values would also be too large simply in terms of the amount.

The factor describing the measurement error would be the same. This also results in a multiplicative deviation relative to the measured value. The equation for calculating is:

For a medium distance of 100 μm from the measuring grid to the component surface and a bending radius of 100 mm, the resulting increase in strain is 1/1000 relative to the current strain value.

The actual strain of the component in this example is 0.1% lower than the measured strain. That means that the stress is measured 0.1% too large. This measurement error is clearly only relevant for small bending radii.

Elastic after-effects

In many materials, the strain still increases somewhat further after spontaneous mechanical loading. This phenomenon is largely complete after about 30 minutes (steel at 23 °C) and also occurs when the load is removed. The quotient of the amount of this additional strain and the spontaneous strain depends heavily on the material. Material after-effects thus produce an additional (positive) measurement error. This only occurs when acquiring strain values.

This deviation can therefore be almost completely avoided in many measurement tasks. However, if the measured value is acquired long after the load is applied, and the strain of the material has increased by 1% (relative to spontaneous strain), the result will be that the measured value for the material strain is 1% too large.

Misalignment of the strain gauge

If the strain gauge is not exactly aligned in the direction of the material stress (uniaxial stress state), a negative measurement error is produced. The measured strain will then be less than the material strain.

The relative strain error is determined as follows:

An alignment error of 5 degrees and a Poisson's ratio of 0.3 (steel) results in a strain error of -1%. Thus, the actual strain and the material strain are 1% greater.

Strain gauge creep

After material strain is induced spontaneously, the measuring grid of the strain gauge creeps back somewhat. The process, determined primarily by the properties of the adhesive and the geometry of the strain gauge (short measuring grids are critical, strain gauges with very long reversing lengths do not creep), is also temperature-dependent.

After return creep the strain of the grid is somewhat less than the material strain. The strain gauge often used in ESA (HBM type LY11-6/120 with an active measuring grid length of 6 mm) when used with adhesive Z70 (HBM) at a temperature of 23 °C has a return creep of about 0.1% within one hour. This is equivalent to a negative measurement error of -0.1% relative to the measured stress. Of course, the deviation will be less if the measured value is determined immediately after spontaneous loading. Due to the negative sign, the strain gauge creep compensates at least partially for the elastic after-effects and may therefore often be completely ignored in ESA. However, advise caution when using other adhesives at higher temperatures. For example, adhesive X60 (HBM) applied at 70 °C with a strain of 2000 μm/m, the resulting deviation after just one hour is -5%.

Hysteresis of the strain gauge

The same applies to the hysteresis: short measuring grids tend to be critical and the adhesive has some effect. The hysteresis for strain gauge LY11-6/120 is only 0.1% with a strain of ±1000 μm/m if Z70 was used as the adhesive. It is therefore negligible. If a very small strain gauge (LY11-0.6/120) with an active measuring grid length of 0.6 mm has to be used though, the hysteresis increases, and with it the uncertainty of the strain or stress measurement to 1%.

The Gauge Factor

Tolerance of the gauge factor

Temperature coefficient (TC) of the gauge factor

It is assumed that the measurement chain is exactly adjusted to the nominal value of the gauge factor (as specified by the manufacturer on the strain gauge package). This factor describes the correlation between the change in strain and the change in relative resistance. It has been determined experimentally by the manufacturer. The uncertainty of the gauge factor is generally 1%. The gauge factor is also specified on the package. It produces the same relative degree of uncertainty in both strain and stress measurements.
The gauge factor is temperature-dependent. The sign and amount of the dependence are determined by the measuring grid alloy. The fact that the TC of the gauge factor is itself temperature-dependent can be ignored for purposes of ESA. The TC for a measuring grid made of Constantan is about 0.01% per Kelvin. Thus, the gauge factor decreases by 0.1% with a temperature increase of 10 K, which is generally negligible. If the measurements were performed at 33 °C, the strain or stress values would deviate upward by just 0.1%. Although at 120 °C, it would be 1%, which is worth considering.

Measuring Grid Length

As generally understood, a strain gauge integrates the strains under its active surface. If the stress field under that surface is non-homogeneous, the relative change in resistance will not correspond to the greatest local strain, but rather to the average strain under the active measuring grid. This is fatal, because it is especially the greatest stresses that are of interest. The measured values therefore deviate downward from the desired maximum values, leading to negative deviations. Since this phenomenon is well known, as are suitable countermeasures (short measuring grid), major errors seldom occur in practical applications.

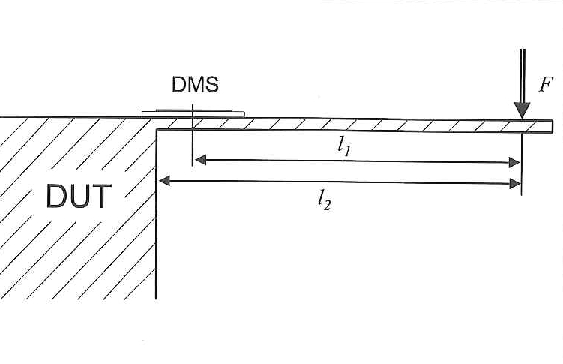
Nevertheless, let’s take an example: The measurement is applied to bending stress at the beginning of the beam. The strain gauge acquires the average strain under its measuring grid (Fig. 3). The strains behave like stresses:

The maximum stress value that is actually wanted could easily be determined in this simple case with a correction calculation. If this is not done, a deviation of the measurement result from the maximum stress will be produced. Its relative deviation is:

If a measuring grid with an active length of less than 2% of l2 is used in the example above, the deviation drops to less than 1% of the measured value. Ultimately the ratio of the maximum strain and the measured strain always depends on the distribution of strain under the measuring grid. If this is known from a Finite Element Calculation, the desired maximum value can be calculated from the arithmetic mean of the stress.

Of course, deviations will occur if the strain gauge is positioned incorrectly. This can also be largely avoided and it must be.

nullnull

Linearity Deviations

Linearity deviation of the strain gauge

Strain gauges with suitable measuring grid materials (Constantan, Karma, Nichrome V, Platinum-tungsten) exhibit excellent linearity. Although for large strains, appreciable deviations can be demonstrated in Constantan measuring grids.

The actual static characteristic curve can be very adequately described (empirically) with a quadratic equation:

If the strains were determined with the relationship    there would be no linearity deviations at all.

However, as the quadratic component is simply neglected in practical applications, the resulting error should be indicated here.

The relative deviation of the determined strain value from the true value is as large as the strain itself: For strains up to 1000 μm/m, the value of the relative strain deviation does not exceed 0.1%. This is equivalent to 1 μm/m, which is negligible. Linearity deviation only becomes appreciable at greater strains: 10,000 μm/m results in 1%, and 100,000 μm/m results in 10%. To a large extent, this is fortunately compensated for by the linearity deviation of the quarter bridge circuit.

Linearity deviation of quarter bridge circuit

Small relative changes in resistance are commonly analyzed with a Wheatstone bridge circuit. As noted above, only one strain gauge per measurement point is usually used in the ESA. Thus, the other bridge resistances are strain-independent.

The correct relationship for the stress ratio in this case is:

Although the relationship is non-linear, linearity is assumed in practical measurement applications (whether or not this is known) and the approximation equation    is used.

The relative deviation resulting from this simplification can be calculated with eq.

A strain of 1000 μm/m (with k = 2) results in a change of 0.2% in the relative resistance. The relative measurement error as determined with eq. 17 is -0.1%. This is equivalent to an absolute deviation of -1 μm/m. The deviation from the true value is negligible. Appreciable linearity deviations occur at greater strains however, as noted above: 10,000 μm/m results in a deviation of -1%, 100,000 μm/m results in a deviation of -9.1%.

When Constantan strain gauges are used (non-linearity similar in terms of magnitude, but with the opposite sign), the two deviations largely cancel each other out and therefore do not need to be considered any further.

Note however that no compensation is ever completely successful, especially given that the gauge factor deviates somewhat from 2 and the actual static characteristic curve does not exactly match the empirical eq. 12.

Summary of partial uncertainties

The individual uncertainties are difficult to correlate with each other. However, to the extent they can be (material after-effects and strain gauge creep, linearity deviation of the strain gauge and quarter bridge circuit), their effects cancel each other out to some extent. Therefore, it is permissible to combine the individual uncertainties with root sum square. The values in bold type above are used to achieve a result for the example.

The uncertainty of the strain measurement is just under 3%. The stress measurement reaches almost 6% of the measured value. That percentage multiplied by the measured value gives the deviation in μm/m or N/mm2. The uncertainty of the modulus of elasticity is generally responsible for the largest amount of error in non-zero-point related measurements in ESA. Additional uncertainties must be considered for zero-point related measurements.

Estimating the measurement uncertainty for zero-point related measurements

In these measurements, the zero point is important. These are typically long-term measurements on buildings and fatigue tests on components. If the zero point changes during measurement tasks of this type, the result is an additional measurement error. The measurement uncertainties already discussed in the last part of this series must be added to the ones noted in this section.

Thermal expansion of the DUT, temperature response of the strain gauge

The material being measured has a coefficient of thermal expansion. The thermal expansion will not be measured, as it is simply the result of temperature as an influence quantity. The measuring grid also has a coefficient of thermal expansion as well as a temperature coefficient of the specific electrical resistance. Since only strains induced by loading are of interest in ESA, the strain gauges that are offered are adapted to the thermal expansion of specific materials. However, all these temperature coefficients are themselves a function of the temperature so this compensation will not be entirely successful.

The remaining deviation ΔƐ can be calculated with a polynomial. The coefficients of the polynomial are determined batch-specifically and are specified by the manufacturer on the strain gauge package. An example of a strain gauge (HBM type LY-6/120) can be found here. The current should be inserted in °C (but without dimensions). Then the remaining deviation (apparent strain) will be determined in μm/m. For a temperature of 30 °C, the resulting apparent strain is -4.4 μm/m. If the ambient temperature deviates significantly more from the reference temperature (20 °C) or if the strain gauge is actually adjusted incorrectly, much greater deviations will occur. These are systemic in nature and can be eliminated by calculations (online as well).

On the other hand, the equation already exhibits an uncertainty that increases by 0.3 μm/m per Kelvin of temperature difference from 20 °C. At a temperature of 30 °C, the uncertainty of the polynomial is 3 μm/m. The only requirements for the correction calculation are to know the thermal expansion coefficient of the material and the ambient temperature.

Self-heating

This refers to the increase in temperature resulting from converted electrical power in the strain gauge. The heat output is determined as follows:  

For a root mean square value of 5 V for the bridge excitation voltage and a 120 Ω strain gauge the resulting heat output is 52 mW. A strain gauge with a measuring grid length of 6 mm applied with a thin layer of adhesive on steel or aluminum is able to give off the heat sufficiently to the measurement object. A small temperature difference will nevertheless arise between the strain gauge and measurement object, which will lead to an apparent strain (see above):  

If the temperature of the adjusted strain gauge is just one Kelvin above the material temperature, there is already an apparent strain of -11 μm/m (ferritic steel) or -23 μm/m (aluminum). The measurement uncertainty can be roughly determined with a simple experiment - the excitation voltage is connected while the load is not applied to the component. In the temperature increase phase, the measured value will drift slightly (zero drift).

The greatest difference between measured values during this thermal compensating process corresponds roughly to the maximum expected deviation. Lower excitation voltages provide a remedy (1 V generates only 2 mW). Strain gauges with higher resistances are also advantageous in this respect. 

For components with poor heat conductance (plastics, etc.) and when very small strain gauges are used, lowering the excitation voltage is indispensable. Caution is always advised when working with rapidly changing temperatures. Compensation effects resulting from adjusting the metal foil of the strain gauge to the material being examined have a time constant.

Swelling of adhesive and measuring grid carrier

The main cause of this is the high mobility of water molecules and the hygroscopic properties of the adhesives and carrier materials. The effect is a zero drift that is not clearly discernible (or distinguishable from the material strains). It may take on high values. A strain is measured which does not exist, at least in the component being examined. This parasitic strain is only partially reversible. Unfortunately there is no way to “grab a hair dryer” and drive out the water molecules. The speed at which the measured value drifts depends on the measuring point protection and ambient conditions. The time constant may be in the range of many hours. A high temperature and a high relative humidity are especially critical. Unfortunately no concrete formulas or figures can be given here.

Insulation resistance

Residue of flux material can also absorb water molecules. This appears in practical applications as a “breathing display” which is often discernible in fluctuating measured values due to a draft or similar cause. Experienced testers will recognize the warning and meticulously clean all contact points. “Baking out” the residue is also possible in some circumstances.

However, all these countermeasures require that the moist parts are not already enclosed under the protective cover of the measuring point, which they often are for good reason. It has proven practical when the measuring point is prepared for covering, to heat it a few degrees Kelvin compared to the prevailing ambient temperature, and then cover it immediately. This will exclude the possibility of condensation forming later under the cover. If the insulation resistances are too low, zero drift of measured values will occur. The insulation resistances within the bridge circuit are extremely critical in this case.

Faulty electrical insulation of strain gauge contacts between each other is comparable to a resistance shunt. It cannot be measured directly, but due to its nature, is similar in magnitude to the insulation resistance. The correlation between the apparent strain and shunt is as follows:

This eq. shows that the effect is lower with high-resistance strain gauges. The following measurement errors are determined for 120 Ω strain gauges (gauge factor = 2):

Under “normal” circumstances, insulation resistances greater than 50 MΩ can be achieved and the deviations of less than 1.2 μm/m are negligible. At 500 kΩ and with a measured value of 1000 μm/m. the zero error would already be -12%! This shows clearly that a significant drop in insulation resistances could cause the measuring point to fail. Strain gauge transducers have insulation resistances of several GΩ.

A high relative humidity with high temperature at the same time (such as saturated vapor) is critical because it leads to a high water vapor pressure. The tiny water molecules push forward and gradually overcome the measuring point protection. It is impossible to predict without a test whether the measuring point will fail after just a few days or several years.

null

Fatigue

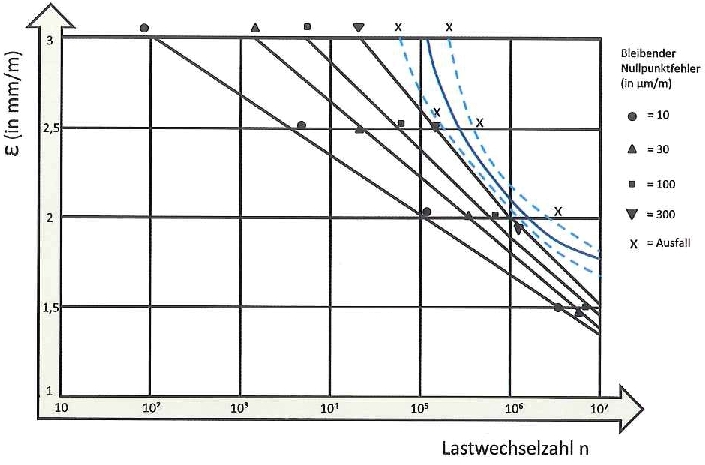
Signs of fatigue in the strain gauge measuring grid appear during dynamic loading of the component that are expressed in a zero drift (apparent strain in the material). The greater the alternating strain amplitude and the greater the number of load cycles, the greater the effect (Fig. 5).

The installation and the arithmetic mean of the strain also affect the zero drift. If the average is negative, the fatigue life improves. If the value is positive, it deteriorates. Practically no zero drift may be expected for alternating strains with an amplitude up to 1000 μm/m. Greater amplitudes are more critical. A zero error of 10 μm/m may be expected for:

1500 μm/m and approx. 2 mil. load cycles
2000 μm/m and approx. 100,000 load cycles
2500 μm/m and approx. 4000 load cycles
3000 μm/m and approx. 100 load cycles

Note that the test specimen also undergoes fatigue. If its resistance to alternating loads is greater than that of the foil strain gauge, use of optical strain gauges should be considered (fiber Bragg grating).

Summary of all partial uncertainties

While the deviations in part 3 of this series are multiplicative in effect and are indicated as a percentage of the measured value, the deviations in this section have an additive effect.

The unit of measurement is μm/m and they are practically independent of the measured value. If the relative deviation is calculated with eq., the value is comparable to those in part 3.

If the values in bold type above are combined using Pythagorean addition, the result is 16.01 μm/m. Since measurement uncertainties should not be rounded, the uncertainty for the zero point is 17 μm/m. With a strain of 1000 μm/m, the deviation expressed as a percentage is 1.7%, which is certainly reasonable. It is clearly critical with small strains: 17 μm/m of 100 μm/m is already 17%.

Now the uncertainty of the zero point (1.7% or 17%) must still be added to the uncertainty from part 3 (3% for the strain measurement). The result of Pythagorean addition is: 4% with a measured value of 1000 μm/m,
18% with a measured value of 100 μm/m.

Usually the mechanical stress is the actual measured quantity so its uncertainty must be estimated. The uncertainty of the stress measurement calculated in part 3 is 6%. Including the uncertainty of the zero point (1.7% or 17%) with Pythagorean addition, the result is: 7% with a strain of 1000 μm/m, 19% with a strain of 100 μm/m. Large relative measurement errors occur with zero-point related measurement tasks, especially with small strains.

null
null

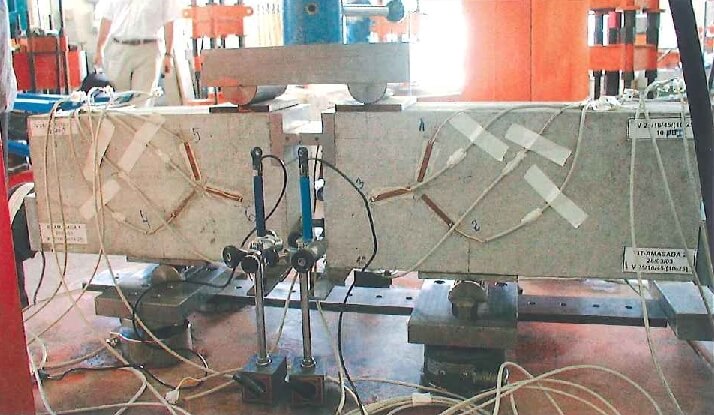
Installed Strain Gauges

null
null
null

The effect of the installer

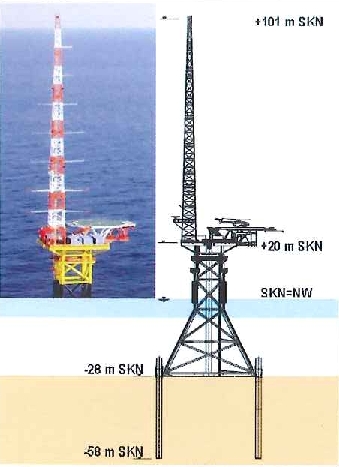
It has been assumed so far that the installation of the strain gauge measurement point was well planned and conscientiously executed. For this reason, only a few of the individual deviations in the examples above exceeded the set range. Although it is unfortunately necessary to point out that if the installation is performed very poorly, the measurement errors could assume arbitrarily large values. Imagine for a moment that a very long strain gauge was used to try to measure a notch stress, or that contact resistances to the strain gauge fluctuate by 0.24 Ω (equivalent to a strain error of 1000 μm/m for a 120 Ω strain gauge). Especially in zero-point related measurements over long periods of time, the importance of measuring point protection cannot be overestimated. An excellent example is the 44 strain gauge measuring points on the FINO 1 research platform (overall height 129 m) in the North Sea (45 km North of Borkum Island). The strain gauges are located 5 to 25 m below the surface of the ocean. Their task was to measure loading strains on the support frame of the platform caused by pile drivers and by waves and wind. After two years in North Sea water, 42 measuring points were still fully functional. Another gross error is if the strain gauge has only a partial internal connection with the surface of the component being examined. Causes may include: poor cleaning or improper handling of the application surface and superimposed adhesive. These causes must and can be avoided. The rubber eraser test generally clarifies the situation. Although it may be possible to dispense with measuring point protection for a short-term measurement (tensile test), installation of strain gauges requires a conscientious approach and frequently a good measure of experience. There is probably no other method of measurement in which the knowledge and experience of the person performing the task play such an important role. This is why companies and institutes are more and more frequently taking advantage of the possibility of certifying their personnel according to VDI/VDE/GESA 2636 on various qualifying levels.
null

Support Content