arrow_back_ios

Main Menu

See All Acoustic End-of-Line Test Systems See All DAQ and instruments See All Electroacoustics See All Software See All Transducers See All Vibration Testing Equipment See All Academy See All Resource Center See All Applications See All Industries See All Insights See All Services See All Support See All Our Business See All Our History See All Our Sustainability Commitment See All Global Presence
arrow_back_ios

Main Menu

See All Actuators See All Combustion Engines See All Durability See All eDrive See All Transmission & Gearboxes See All Turbo Charger See All DAQ Systems See All High Precision and Calibration Systems See All Industrial electronics See All Power Analyser See All S&V Hand-held devices See All S&V Signal conditioner See All Accessories See All DAQ Software See All Drivers & API See All nCode - Durability and Fatigue Analysis See All ReliaSoft - Reliability Analysis and Management See All Test Data Management See All Utility See All Vibration Control See All Acoustic See All Current / voltage See All Displacement See All Load Cells See All Pressure See All Strain Gauges See All Torque See All Vibration See All LDS Shaker Systems See All Power Amplifiers See All Vibration Controllers See All Accessories for Vibration Testing Equipment See All Training Courses See All Whitepapers See All Acoustics See All Asset & Process Monitoring See All Custom Sensors See All Data Acquisition & Analysis See All Durability & Fatigue See All Electric Power Testing See All NVH See All Reliability See All Smart Sensors See All Vibration See All Weighing See All Automotive & Ground Transportation See All Calibration See All Installation, Maintenance & Repair See All Support Brüel & Kjær See All Release Notes See All Compliance See All Our People
arrow_back_ios

Main Menu

See All CANHEAD See All GenHS See All LAN-XI See All MGCplus See All Optical Interrogators See All QuantumX See All SomatXR See All Fusion-LN See All Accessories See All Hand-held Software See All Accessories See All BK Connect / Pulse See All API See All Microphone Sets See All Microphone Cartridges See All Acoustic Calibrators See All Special Microphones See All Microphone Pre-amplifiers See All Sound Sources See All Accessories for acoustic transducers See All Experimental testing See All Transducer Manufacturing (OEM) See All Accessories See All Non-rotating (calibration) See All Rotating See All CCLD (IEPE) accelerometers See All Charge Accelerometers See All Impulse hammers / impedance heads See All Cables See All Accessories See All Electroacoustics See All Noise Source Identification See All Environmental Noise See All Sound Power and Sound Pressure See All Noise Certification See All Industrial Process Control See All Structural Health Monitoring See All Electrical Devices Testing See All Electrical Systems Testing See All Grid Testing See All High-Voltage Testing See All Vibration Testing with Electrodynamic Shakers See All Structural Dynamics See All Machine Analysis and Diagnostics See All Process Weighing See All Calibration Services for Transducers See All Calibration Services for Handheld Instruments See All Calibration Services for Instruments & DAQ See All On-Site Calibration See All Resources See All Software License Management
null

1. Introduction and Motivation

Ultra-high performance concrete (UHPC) is a new, very structurally dense concrete with a high strength of up to 250 N/mm2, that is similar to steel. It is up to ten times stronger than ordinary concrete and demands innovative design concepts, that are more like lightweight construction than traditional concrete construction.

The material advantages and special qualities of UHPC compared to normal concrete, produce structural solutions that are characterized by a significantly lower intrinsic weight and by "open structures". This type of structure is vastly more susceptible to dynamic excitation and fatigue loading than normal concrete constructions.

As, in UHPC structures, predominantly uniaxial stresses occur in rod-shaped components, and multiaxial stresses in compact components and when introducing concentrated forces, it is the aim of a research project supported by the German Research Foundation (DFG) as part of a priority program, to investigate both analytically and by experiment, the fatigue behavior of UHPC under uniaxial and triaxial loading.

The parameters for a three-dimensional, mechanical model for UHPC with anisotropic damage should be defined by analyzing principal meridian tests (the rotationally symmetrical stress and deformation states).

2. Three-dimensional, Mechanical Model for UHPC

2.1. Basics

The numerical analysis of concrete and reinforced concrete support structures with FEM programs requires suitable mechanical models, which can realistically describe the non-linear material response, the progressive crack formation and damage, and the potential failure states.

A detailed overview of the models developed for the mathematical description of the non-linear material response for standard strength concrete, can be found in [Grünberg/Göhlmann-2005].

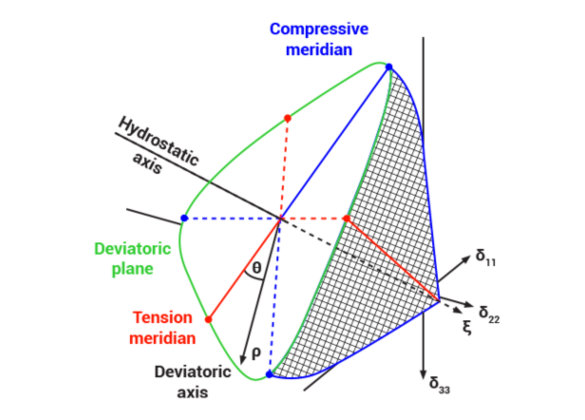
The fracture envelope is usually described geometrically as a function of the invariants I1, J2 and J3 [Chen-1982]. I1 represents the hydrostatic stress state, whereas J2 and J3 are expressed by components of the stress deviator.

The formulation in the Haigh-Westergaard coordinates ξ, ρ and θ is useful. Any stress state σ is described by the hydrostatic stress component ξ, the deviator stress ρ and the deviator angle θ (see Figure 1).

2.2. Three-phase Model for UHPC

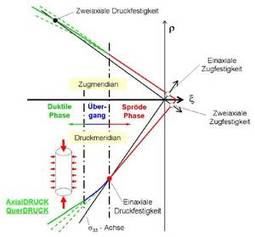
Traditional failure models are only of limited use for ultra-high performance concrete. This is why the three-phase model has been enlisted and developed for UHPC [Grünberg et al.-2007]. In this model, both the brittle and ductile material responses are described by the characteristic curves of the principal meridians, in particular the compressive meridian of the fracture envelopes.

With uniaxial loading, the ultra-high performance concrete is marked by brittle failure both with tension and with compression. This characteristic is not changed by adding fibers. It is to be expected that this brittleness will substantially modify the tensile and compressive meridian curves. To develop the three-dimensional mechanical model of UHPC with anisotropic damage under multiaxial loading, it is necessary to know these compressive and tensile meridian curves (see Figure 1, right).

Fig. 1: Fracture envelope, shown in the Haigh-Westergaard coordinates (top) and the three-phase model for UHPC in the principal meridian section

The principal meridian stress states are particularly interesting for the three-phase model that has been developed. These are the stress states with predominantly compressive loading in the axial direction and the rotationally symmetrical transverse stress states.

To determine the requisite parameters, static as well as dynamic uniaxial and triaxial experimental investigations are being carried out at the Institut für Massivbau (Institute for Concrete Construction) at the University of Leibnitz in Hanover.

3. Experimental Investigations

3.1. Compressive Meridian Tests

The compressive meridian is particularly important for the application, because this is where the stress ratios relevant to building practice are to be found. The stress ratios produced by the superposition of a low, hydrostatic compressive loading with a high compressive loading in the axial direction, are investigated in the triaxial test cell. These investigated stress ratios are found on the compressive meridian and are thus above the uniaxial strength. In concrete, even a low transverse pressure loading can result in a clear increase of the axial bearing strength.

The investigations were carried out on cylindrical UHPC test specimens = 60 mm). The "M2Q mixture" from ∅ (h = 180 mm, DFG Priority Program 1182 "Sustainable building with UHPC" [Schmidt-2008] was used. A strength of fcm = 198 MPa was achieved in the comparative uniaxial investigations.

3.2. Triaxial Test Cell and Instrumentation

Triaxial test cells have already been used many times to determine the static, multiaxial strength of concrete [Dahl-1992], [Rogge-2002]. But the more important field of application by far is geotechnical engineering and rock mechanics. The advantage of this test apparatus is that the transverse pressure loading is applied to the test specimen hydraulically, without preventing deformation in the axial direction.

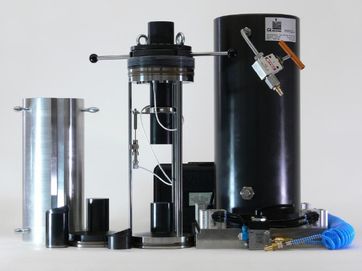
Special sealing systems and a specific control for the phase-synchronized loading of the sample were required for the dynamic investigations intended here. The DBTA60-100-RT-DYN triaxial test cell (Figure 2), which is designed for dynamic loadings of up to 5 Hertz, was developed in cooperation with the manufacturer.

Fig. 2: DBTA60-100-RT-DYN dynamic triaxial test cell

The pressure chamber is sealed against the upper load stamp by a step seal let into the upper closure. Axial force is applied by a 1 MN cylinder of an existing universal loading frame. The transverse pressure is generated directly by the servo-hydraulic test device and is driven, phase-synchronized with the 5 Hertz loading frequency, by the PCS 8000 multi-channel control made by Walter & Bai. A 3 mm thick, nitrile butadiene rubber sample sleeve protects the UHPC test specimen from the oil.

Because the oil pressure chamber is so large, it is also possible to place additional measurement technology directly on the test specimen, in the surrounding oil (see section 3.2.3).

The measurement signals can be taken out of the pressure vessel by a total of 8, 4-wire electrical leadthroughs. The test cell is designed for oil pressures up to 1000 bar. The volume of oil in the cell can be reduced from approx. 8 liters to approx. 1.5 liters with the aid of special aluminum packing, so that a "proper" sinusoidal loading can be implemented in the transverse direction as well.

3.2.1. Test Rig and Measurement Acquisition

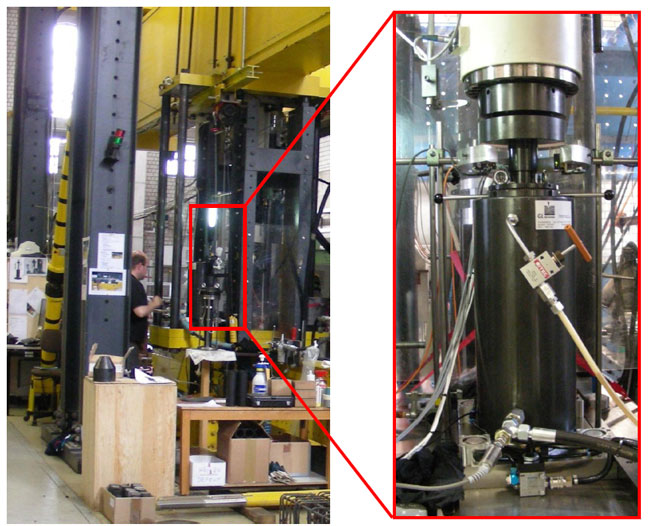
The triaxial test cell was installed in the existing servo-hydraulic test rig (Figure 3), integrated into the new control system and connected to the amplifier.

The integration of the manufacturer's individual components (triaxial test cell, hydraulics & control and measurement technology) into a test rig with simple test sequences, is an in-house development of the Institute for Concrete Construction at the University of Leibnitz, in Hanover.

Fig. 3: Triaxial test cell in the test rig

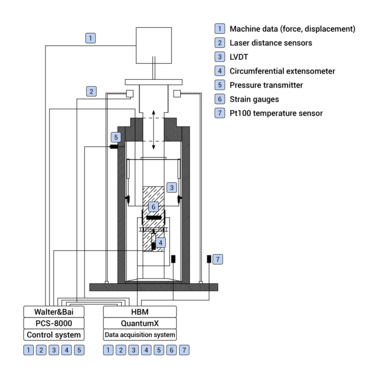
Some of the measurement channels are also relevant to control. It is therefore necessary to first record these channels (cylinder pressure, LVDTs, circumferential extensometer) with the PCS-8000 control system, and then, in the same control timing (0.125 ms), transfer them to the amplifier, again via the analog output modules (0-10 V). This diversion is not necessary for the pressure transmitter (transverse pressure) and the laser distance sensors, as the voltage signal for both the systems can be measured in parallel.

To enable a sufficient number of measurement channels to be recorded, three universal amplifiers of type QuantumX MX840B from HBM were cascaded up to a total of 24 measurement channels available. This amplifier also supports carrier frequency (CF) full-bridge excitation and thus is protected against electromagnetic interference. The measured values are visualized, cross calculated and recorded on the PC using catman Easy, also from HBM.

For the loading frequency of 5 Hz, a channel data rate of 200 S/s was selected and filtered in real-time with Bessel/20 Hz so that the control system, too, gets a smooth signal. This sampling rate also allows the peaks to be recorded with an appropriate resolution whilst keeping the accumulated data volume of longer tests (up to 1.5 billion load cycles) at a reasonable size and in different formats (bin, ASCII). Strain gauges and temperature sensors were exclusively acquired by QuantumX. The system's modular arrangement allows an elegant scaling for the many different tests in our lab.

Figure 4 shows a diagram of the test setup with the triaxial test cell, instrumentation, control system. and measurement acquisition.

Fig. 4: System outline: triaxial test cell, instrumentation, control system and amplifier

More details of the instrumentation used and its special qualities, are given in the sections below.

3.2.2. Measurement Technology Outside the Triaxial Test Cell

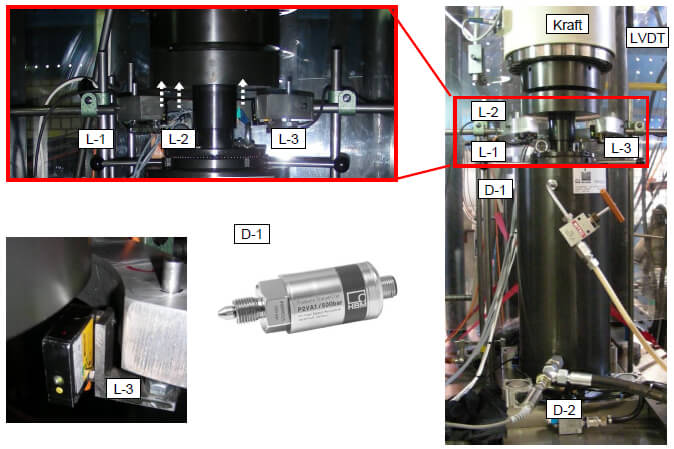
The PZ-D 1000/600 servo-hydraulic test cylinder made by Walter&Bai, that was used for the axial loading, has a maximum piston stroke of 250 mm and can apply a load of up to 1 MN. The cylinder displacement is recorded by an LVDT WA200 inductive displacement transducer from HBM, with a measuring range of ±200 mm. The load cell between the cylinder and the spherical cap has a measuring range of ±1000 kN.

Fig. 5: Measurement technology outside the triaxial test cell

A P2VA1 pressure transducer (D-1) screwed into the triaxial test cell from outside in the upper area of the pressure chamber, records the oil pressure (up to 1000 bar) and returns a voltage signal (0.5-10 V). For some of the tests, an additional P5MA absolute pressure transducer (D-2), with a measuring range up to 500 bar, was used at the lower cell inlet. This measurement signal was directly acquired by the QuantumX amplifier. On the one hand, this meant that the measurement signal of the pressure transducer could be monitored (redundancy), and on the other, that this second pressure sensor could be used to check whether a phase shift occurs in the pressure chamber during dynamic loading.

The distance between the test bench with the complete triaxial test cell on it, and the spherical cylinder cap, is registered by three laser distance sensors, L−1 to L−3. The sensors that are used have a measuring range of between 16 and 26 mm, with a resolution of 5 µm, and return a voltage signal (0-10 V) for this range. The advantage of laser distance sensors, particularly in dynamic investigations, is that they do not have any mechanical components, and can therefore also endure vast numbers of load cycles without wearing. The deformations measured by the laser distance sensors include not only the pure deformation of the test specimen, but also deformation content from the upper and lower load stamps, as well as the non-linear effects of startup.

To exclude this additional and sometimes non-linear deformation content, the instrumentation must be placed directly on the test specimen, in the oil.

3.2.3. Measurement Technology Inside the Triaxial Test Cell

The longitudinal and transverse strains are measured directly on the test specimen, using a circumferential extensometer in the center of the sample cylinder, and three differential transformers, each offset by 120°.

Another way to record the deformation development is to use strain gages (SG), applied to the UHPC test specimen. The special aspect here is that the strain gages are directly exposed to an ambient pressure of up to 1000 bar.
Eight pressure-proof electrical leadthroughs (4-pin Lemo S0 4) in the cover of the cell allow you to be flexible about using different measuring instruments in the cell.

Inductive displacement transducers in a differential transformer circuit (LVDT)

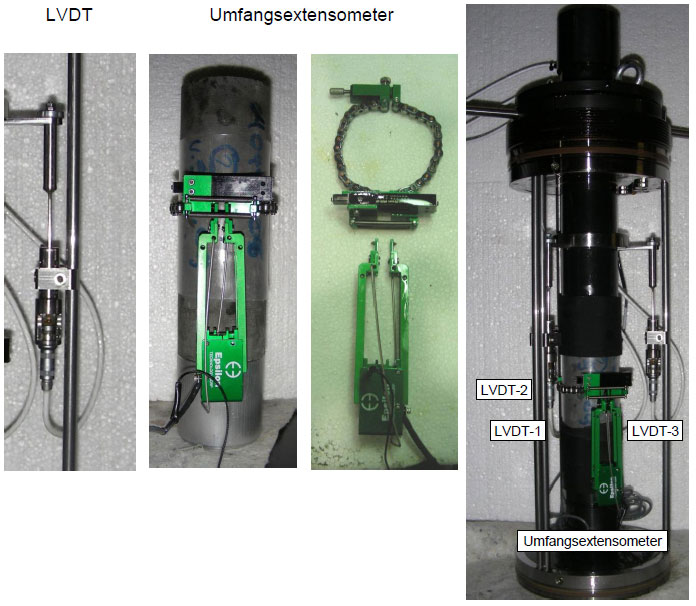
A clamping device for three LVDTs, LVDT–1 to LVDT–3, allows the axial deformation of the sample to be measured very close to the test specimen. According to the manufacturer, the LVDTs can be used at oil pressures up to 1000 bar, and have a measuring range of ± 5 mm. The clamping ring is close to the test specimen, on the upper load stamp, and has a magnetic retainer for the plunger, at 120° increments, to protect the LVDT, should the measuring range be exceeded (see Figure 6, left).

Fig. 6: Inside setup of triaxial test cell and instrumentation

Circumferential extensometer

The circumferential extensometer is designed for use inside pressure vessels, with mineral oil as the pressure medium (up to 1350 bar), and it allows changes in the circumference of the cylindrical concrete sample to be measured. The extensometer is attached directly to the sample by a high-precision chain of special rollers. The complete unit is automatically held by the integral springs.

The zero point is easily adjusted by a mechanical setting screw. The measuring range of the clip, which has a measurement principle based on a strain gage full bridge, is 12 mm in total (-2 mm to +10 mm). A breakaway device prevents destruction of the extensometer, should the test specimen suddenly fracture.

To prevent the measurement results being falsified by the elastic MBR sample sleeve, very thin, transparent Fluoropolymer shrink-fit tubing was used for tests with the circumferential extensometer in the central area of the test specimen (see Figure 6, right).

Strain gages

Whereas the methods of measurement previously described all represent integral measurement over the entire circumference and height of the sample, strain gages can be used to observe the local development of deformation. It is worth noting here that when using strain gages, preparation of the test specimen, and incorporation into the cell are appreciably more time-consuming and cost-intensive.

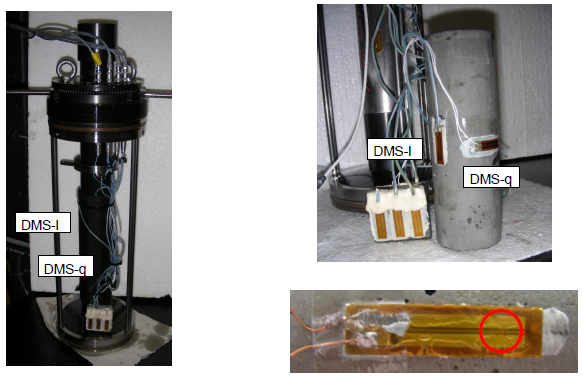
LY41-20/120 strain gages from HBM, with a measuring grid length of 20 mm, are used here. These are applied to the concrete with X60 adhesive, after the surface has been slightly roughened and cleaned. Solder terminals (LS 5) are also used, as the connection cables will be loaded more heavily when the test specimen is inserted into the MBR sleeve. As many as three strain gages can be positioned vertically (SG-l), and horizontally (SG-t), as required. The connection cables run inside the sample sleeve and reach the oil chamber at the top end of the sleeve (Figure 7).

The active ¼ bridge is extended to a half bridge by a compensating strain gage. The compensating strain gage is also located on a UHPC specimen in the oil-filled pressure chamber of the cell. During the tests, both the strain gages are heated equally by the oil circulating around them. Preliminary tests have shown that the transverse pressure has very little influence on the measured values. Strain gage measurement works very reliably in static tests, but with the dynamic transverse pressure loading, there are an increasing number of strain gage failures (see section 3.2.5), caused by the tiny air voids close to the surface, below the strain gages, that had not previously been visible (see Figure 7, right).

Fig. 7: Test specimen with strain gages applied

Temperature sensors

An encapsulated Pt100 sensor (resistance thermometer) was used as a temperature sensor to record the oil temperature in the pressure chamber. Dynamic loading causes the oil in the pressure chamber to heat up to approx. 50°C. A further Pt100 sensor recorded the ambient temperature right next to the triaxial test cell in the test rig. The resistor was extended to a half bridge for connection to the amplifier.

3.2.4. Results of Static Tests

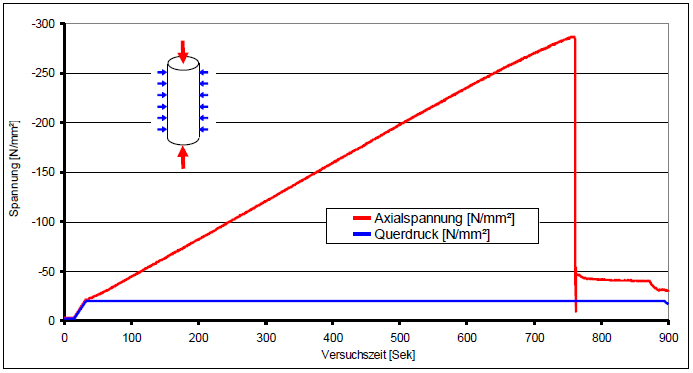
The static tests always followed the same pattern. In a first step, the hydrostatic stress state was increased until the desired transverse pressure (here 200 bar = 20 N/mm²) was achieved, then loading in the axial direction progressed at a constant cylinder advance, until fracture (here 287.1 N/mm²). The axial stress and the transverse pressure over time are shown in Figure 8.

Fig. 8: Axial and transverse stress curves

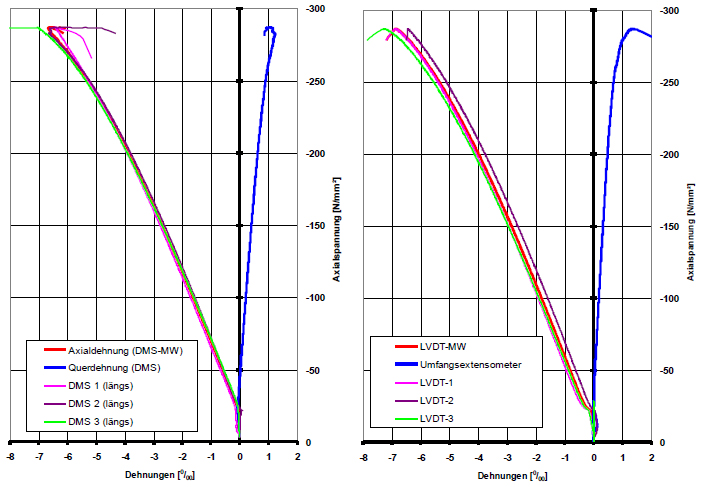
After the initial installation of the test rig, extensive test series were carried out with strain gages installed in parallel (along and across), LVDTs, circumferential extensometers and laser distance sensors. Figure 9 (left) shows the axial and transverse strains determined by the strain gages on the UHPC test specimen. As a comparison, look on the right of Figure 9 at the axial strains determined from the LVDTs, and the transverse strain defined by the circumferential extensometers. The measured values of the LVDTs were reduced by calculating the steel deformation of the load stamp.

Fig. 9: The strain curves of strain gages (left) and LVDTs (right)

Both methods of measurement produced virtually the same axial stress on fracture (εB ≈6.8 0/00). With the LVDTs, a small, non-linear startup effect is noticeable after starting the initial hydrostatic load. This is as a result of the upper and lower load stamps pressing against the test specimen. The strain gages purely record the test specimen strain.

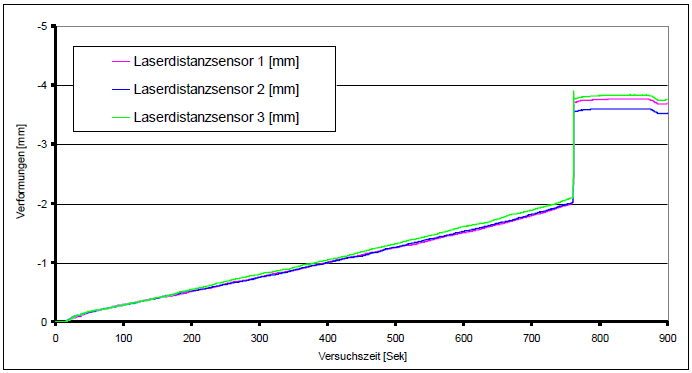
The deformation measurements with the laser distance sensors (Figure 10) between the test bench and the force plate of the axial cylinder, include far more influences from the test setup. These include elastic content from the steel load stamp and linear deformation content from the test setup, as well as content from the non-linear startup effects, that decrease as the axial load increases.

Fig. 10: Deformation measurement by laser distance sensors

3.2.5. Results of Dynamic Tests

Because of the packing, it is not possible to use all the other instruments on the inside during dynamic loading. So the only way to record the development of the deformation directly on the test specimen in these tests is to use strain gages. The problem is that in these tests, the strain gages fail as the number of load cycles increases.

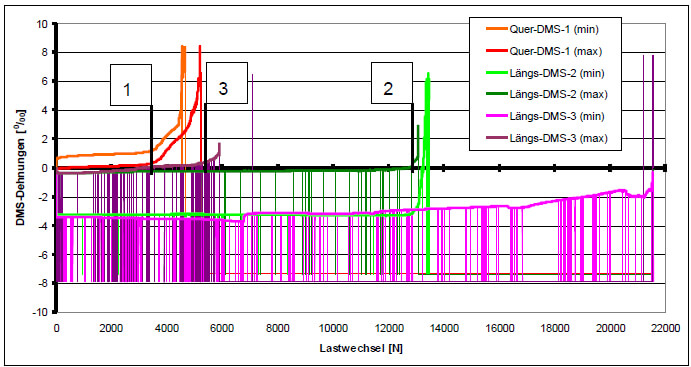
The dynamic tests carried out for different maximum stresses (75%,..., 50%) are always at a constant minimum stress (5%). The reference quantity is the particular breaking load under static, triaxial stress. Figure 11 shows the minimum and maximum strains for each load cycle over the number of cycles, until fracture after 21558 load cycles, for a test with a maximum stress of 55%. Intermediate failures are recognizable by the vertical lines (measured value "-8‰"). SG-1 shows the transverse strain, whereas SG-2 and SG-3 show the axial strain.

If you look at the transverse strains, it is noticeable that here, the strains up to approx. 3500 load cycles (point 1) match the expected curve without failures (approx. 20% of the axial strains). The values then "drift", with the strain differential remaining constant. After barely 5000 load cycles, the strain gage finally fails.

Fig. 11: Strain gage measured values during dynamic loading

SG-2 returns realistic measured values up to approx. 13000 load cycles (point 2), even if there are a few failures. The strain values at minimum stress for SG-3 correspond well to those of SG-2, up to approx. 5000 load cycles (point 3). SG-3 at minimum stress (minimum compression of the test specimen) then returns no further measured values, whereas the same strain gage at maximum compression returns plausible values up until fracture.

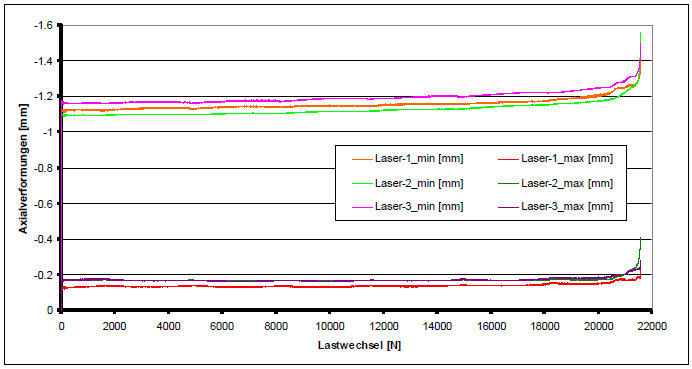
Once the strain gages have failed, the last measurand remaining in the dynamic tests is supplied by the laser distance sensors outside the triaxial test cell.

Recognizable in their curve (Figure 12) is the characteristic development of deformation found in concrete under fatigue loading.

Fig. 12: Deformation measurement of the laser distance sensors during dynamic loading

4. Summary and Perspective

With the "triaxial cell" test rig described above, it is possible to determine the triaxial strengths for both static and dynamic loadings.

The use of sensors in the oil-filled pressure chamber of the triaxial test cell is particularly demanding of the measurement technology deployed. By using special inductive displacement transducers (LVDTs) and a circumferential extensometer, it is possible to determine the deformations in static loading directly on the UHPC test specimen. These deformations were verified by strain gages applied directly to the test specimen. For major test series, this saves cost (the material costs of the strain gages) and time in preparing the test specimen (attaching the strain gages).

The problem is metrologically recording the development of the deformation in the dynamic investigations. Because packing is required, it is only possible to use strain gages here. The repeated dynamic loading vertically onto the surface of the strain gage pushes the strain gage into the tiny air voids in the concrete. This eventually causes the strain gage to fail prematurely. Laser distance sensors attached outside the test cell record the characteristic curve of deformation development.

Triaxial tests showed that the three-phase model that has been developed, describes the compressive meridian of the fracture envelope rather well. A transverse pressure loading produces a more ductile material response in the UHPC, compared to the brittle qualities in uniaxial loading.

A detailed report on the ongoing triaxial dynamic investigations and the Wöhler lines that are developed from them, will be given at the 3rd fib-Congress [Ertel/Grünberg-2010].

Acknowledgements

The research project is supported by the German Research Foundation (DFG) in Priority Program 1182: "Sustainable building with UHPC".

References

[Chen-1982] Chen, W. F.:Plasticity in Reinforced Concrete. McGraw-Hill, New York, 1982.

[Dahl-1992] Dahl, Karre K. B.; The Calibration and Use of Triaxial Cell, Danmarks Tekniske Hojskole, 1992

[Düsterloh 2007] Düsterloh, U.: Triaxiale Kompressionsversuche an UHPC-Beton, Bericht (unveröffentlicht), Institut für Aufbereitung und Deponietechnik, Professur für Deponietechnik und Geomechanik, Technische Universität Clausthal, 2007

[Ertel/Grünberg-2010] Ertel, Chr.; Grünberg, J.: “Triaxial Fatigue Behaviour of Ultra High-Performance Concrete”; 3rd fib International Congress; May 29 – June 2, 2010, Washington, D.C. (accepted)

[Grünberg/Göhlmann-2005] Grünberg, J.; Göhlmann, J.: Versagensmodelle für Beton unter monotoner Beanspruchung und Ermüdung. Bauingenieur, Band 80. März 2005

[Grünberg et al. 2007] Grünberg, J., Lohaus, L., Ertel, C. Wefer, M.: Mehraxiales mechanisches Ermüdungsmodell von Ultra-Hochfestem Beton – Experimentelle und analytische Untersuchungen, Beton- und Stahlbetonbau, Heft 6, 2007

[Grünberg et al. 2008] Grünberg, J., Lohaus, L., Ertel, C. Wefer, M.: Multi-Axial and Fatigue Behaviour of ultra–high–performance concrete (UHPC), Proceedings of the 2nd International Symposium on Ultra-High Performance Concrete, 05.-07.03.2008, Kassel

[Kupfer-1973] Kupfer, H.: Das Verhalten des Betons unter mehraxialer Kurzzeitbelastung unter besonderer Berücksichtigung der zweiaxialen Beanspruchung. DAfStb, Heft 229, Ernst & Sohn, Berlin, 1973.

[Rogge-2002] Rogge, Andreas; Materialverhalten von Beton unter mehraxialer Beanspruchung, Dissertation, Lehrstuhl für Massivbau, TU München, 2002.

[Schmidt-2008] Sachstandsbericht Ultrahochfester Beton, Deutscher Ausschuss für Stahlbeton, Heft 561, Beuth, 2008

Support Content

No more result to load