arrow_back_ios

Main Menu

See All Software di analisi e simulazione See All Software DAQ See All Driver e API See All Utilità See All Controllo delle vibrazioni See All Sistemi di alta precisione e calibrazione See All Sistemi DAQ See All Dispositivi portatili S&V See All Elettronica industriale See All Analizzatore di potenza See All Condizionatore di segnale S&V See All Trasduttori acustici See All Sensori di corrente e tensione See All Sensori di spostamento See All Sensori di forza See All Load Cells See All Multi Component Sensors See All Pressure Sensors See All Strain Sensors See All Estensimetri See All Temperature Sensors See All Tilt Sensors See All Torque Sensors See All Vibration Transducers See All Accessories for Vibration Testing Equipment See All Vibration Controllers See All Measurement Exciters See All Modal Exciters See All Power Amplifiers See All LDS Shaker Systems See All Test Solutions See All Actuators See All Combustion Engines See All Durability See All eDrive See All Production Testing Sensors See All Transmission & Gearboxes See All Turbo Charger
img

expand_more
chevron_left
chevron_right

Degradation Analysis in Step-Stress Accelerated Testing

Step-stress testing is a very common type of accelerated testing. It is a good way to obtain failures in a relatively short amount of time. There are many variations of step-stress testing. A common type is one in which the units are tested at a given stress level for a certain amount of time. At the end of that time, if there are units surviving, the stress level is increased and held for another amount of time. The data that result from such tests can be analyzed using the cumulative damage model, which computes the degradation (damage accumulated through time and through the increase of stress), in ReliaSoft Weibull++'s Accelerated Life Testing module

Alternatively, there are step-stress tests in which the degradation or performance data that can be directly related to the presumed failure of the product in question are monitored over the duration of the test. This test is essentially a degradation test in time-varying conditions. In this case, the "cumulative damage" (degradation) is measured over time and there is no need to use the complex cumulative damage model to estimate the reliability of the product. This article suggests an approach for using Weibull++ to estimate reliability from degradation data of a product tested using step-stress accelerated testing.

Example


A semiconductor company is studying the reliability of Light Emitting Diodes (LEDs) using a step-stress accelerated temperature test to estimate the reliability at the normal conditions of TN= 200K. For LEDs, failure has traditionally been defined in terms of the amount of degradation in luminosity or luminous flux (in lumens per radiated watt). For this particular LED product, the industry defines failure as 50% degradation from the original luminous flux of 700 lm.

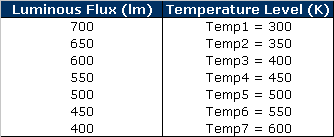
The following is the test procedure. A sample of 15 units are tested in a temperature bath. Each unit is tested under the designated test profile independently from the other units. The luminous flux degradation is monitored for every unit in the test. The test's temperature is initially set at T= 300K and is then increased by 50K for every 50 lm drop in luminous flux.

Table 1: Temperature Setting for LED Test at Luminous Flux Level
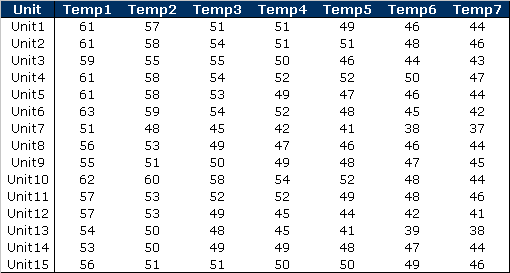
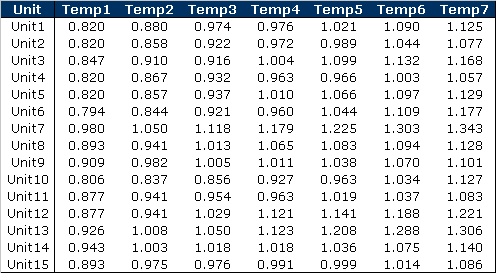
Because the change of temperature is decided based on degradation, the duration of testing at a specific temperature level might be different for every tested unit. Also, for a given test unit, the amount of time it spends in a specific temperature level might be different for every temperature level. The following are the test results, showing the duration each unit spent at each temperature level before the luminous flux dropped an additional 50 lm. The units were monitored until the failure threshold value of 50% degradation (LF = 300 lm) was reached.
Table 2: Time (h) Spent by Each Test Unit at Each Temperature Setting
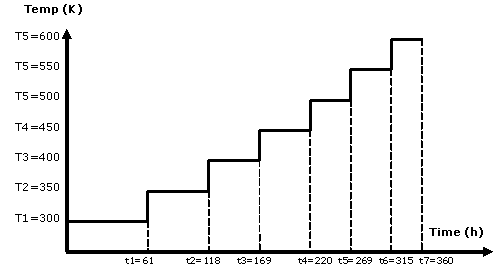
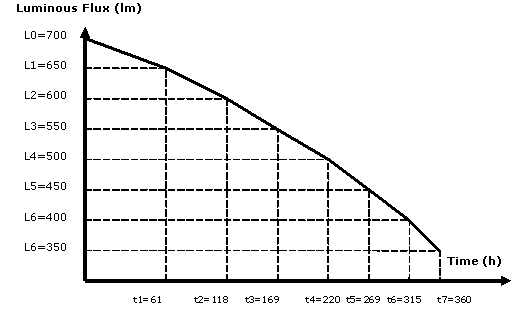
To better explain the test profile, the following figures show the test profile and its corresponding luminous flux curve for one of the test units (Unit1) in a cumulative time line.

The purpose of this test is to estimate the reliability of the LEDs at the normal continuous usage conditions of TN=200K.

Step 1: Estimating a Degradation Rate vs. Stress Model for Every Unit in the Test


For illustration purposes, let us assume that the luminous flux decreases linearly over time at a certain temperature level, Ti  (Chiao, Hamada, 1996). Therefore, the relationship between luminous flux (L) and time (t) can be described as follows:

 Eqn. (1)


where L= 700 lm is the initial luminous flux and λis the degradation rate. Note that other models could be considered.

Table 1 can be used to estimate degradation rate at a certain temperature value. The degradation rate, λi, can be estimated by calculating the drop of luminous flux over a certain change of time. Therefore:

Eqn. (2)


In the studied experiment, the temperature is changed once a drop of 50 lm has been observed, thereforeΔLi = 50 lm consistently.

From Table 2, we obtain the following table that uses Eqn. (2) to estimate the degradation rate, λi, at a certain temperature level, Ti. Note that in this case the degradation rate is a random variable, therefore each unit's data set enables us to estimate a possible value of degradation for a certain temperature level.

Table 3: Degradation Rate λ (lm /h) for Different Temperature Levels
We now use the Equation Fit Solver in Weibull++ to fit a model that describes the degradation rate versus temperature. To add an Equation Fit Solver folio to a project, choose Home > Insert > Equation Fit Solver.

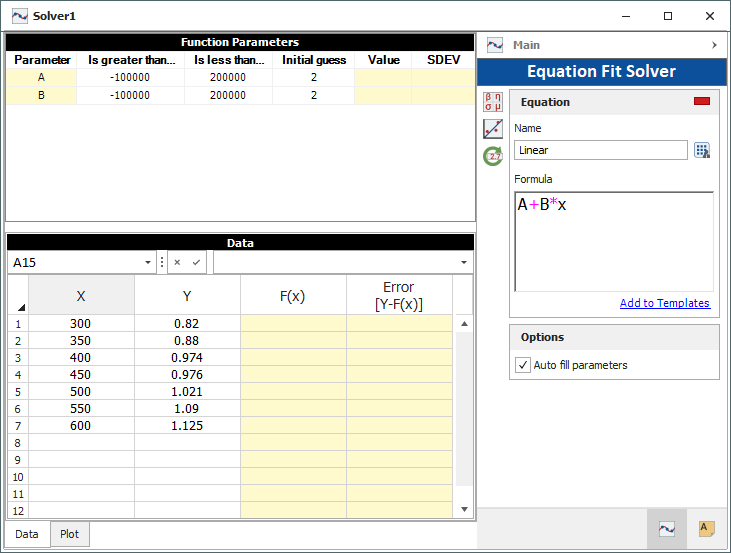
Enter the temperature data in the X column and the degradation rate data in the Y column. Create an equation that defines degradation rate versus temperature by entering the equation in the Formula field and giving it a name. The assumed equation shape is a linear shape (i.e., degradation rate vs. temperature is considered to be a linear relation):


where Ti is temperature level.

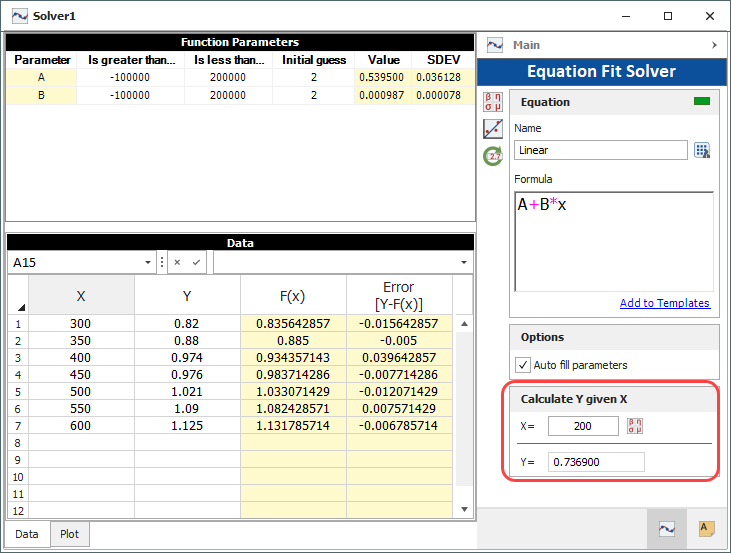
Note that other types of models (such as exponential) can be used. The following shows an example using Unit 1 data. The range of possible parameter values and initial guesses are specified in the Function Parameters area.
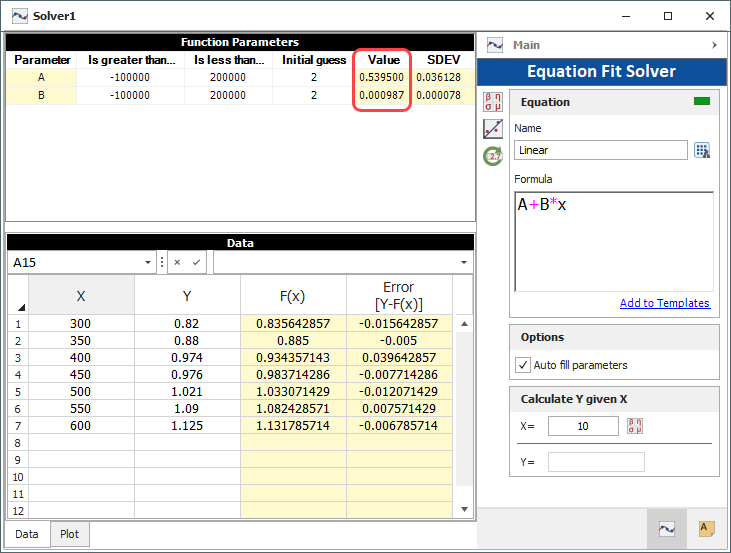
The folio is now ready to estimate the parameter of the degradation rate model. Click Calculate. You can see the estimated parameters in the Value column in the Function Parameters table.
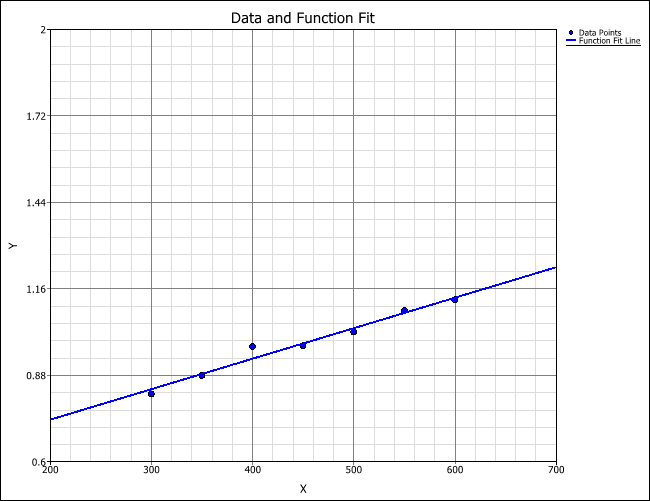
A plot of the fitted model can also be obtained by clicking the Plot icon.
Repeat the above procedure for all the units' data sets to obtain the degradation rate model parameters for every unit in the test.

Step 2: Estimate the Degradation Rate for Normal Use Condition


The degradation model can help in understanding what the degradation rate would be if a unit were tested under normal conditions of TN= 200K.

Using the Equation Fit Solver, we can estimate the degradation rate for a certain temperature value. In the Calculate Y given X section, enter the X=200 value and click  to obtain the estimated degradation rate value for TN= 200K.

The estimated degradation rate at TN = 200K for Unit 1 is λ= 0.7369 lm/h.

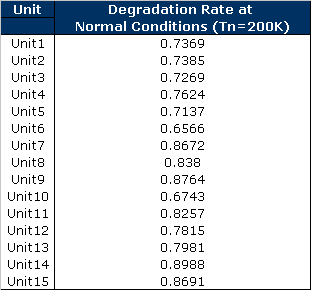
By repeating this process for all of the tested units, the projected normal degradation rates, λN, for each unit can be derived. The following table summarizes the results.
Table 4: Projected Degradation Rate at Normal Use Conditions

Step 3: Estimate the Normal Condition's Failure Times


With the degradation rate at normal condition, the failure time for each unit can be estimated. Modifying Eqn. (1) to solve for the failure time tF, the equation becomes:

 Eqn. (3)


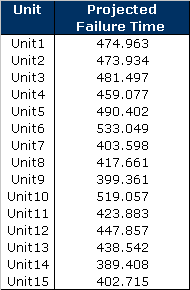
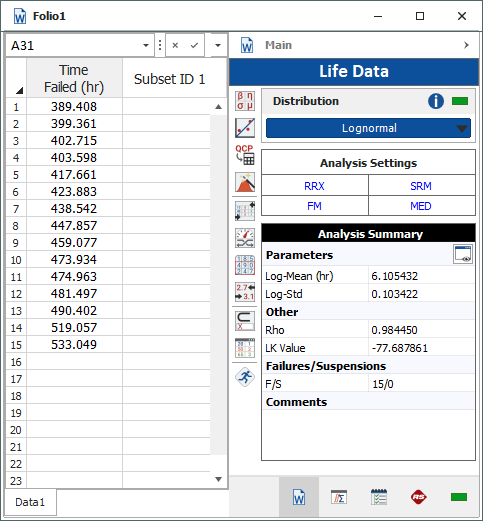
Using Eqn. (3) and Table 4, the estimated failure times for each unit had they been continuously tested under the normal condition, TN, are:

Table 5: Projected Failure Times Under Normal Use Conditions

Step 4: Obtain a pdf Model and Use it to Make Reliability Inferences


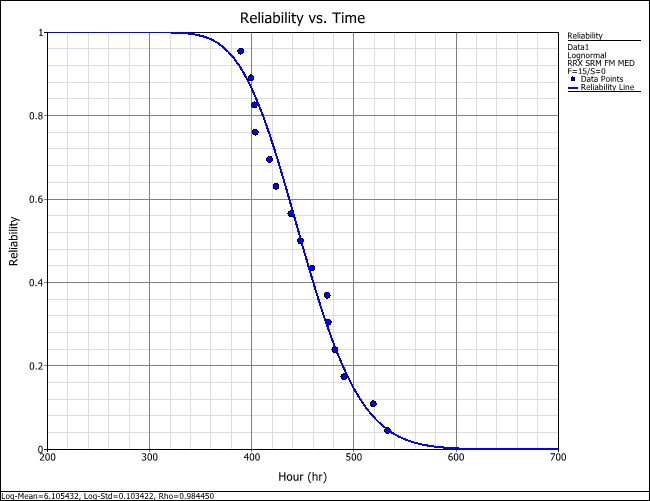
Using the data in Table 5, the reliability estimation using life data analysis becomes straightforward. The lognormal distribution and regression (RRX) are used to fit the failure data.

The reliability plot is as follows:
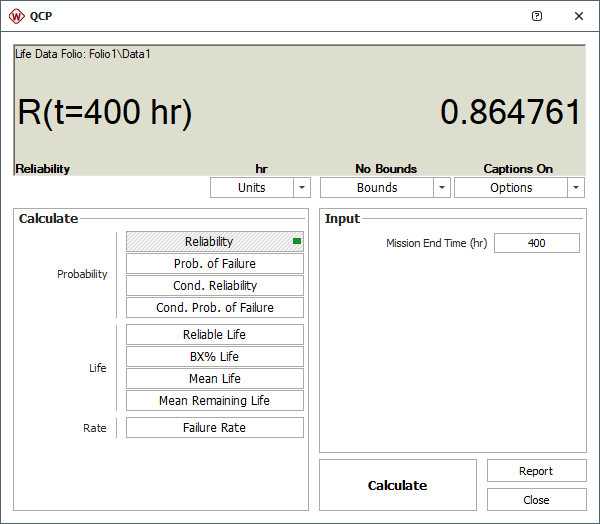
The reliability at t=400h of normal LEDs operation is estimated using the QCP as follows:

Reference


C. Chiao, M. Hamada, "Robust Reliability For Light Emitting Diodes Using Degradation Measurements", Quality and Reliability Engineering International, Vol. 12, 89-94 (1996).