arrow_back_ios

Main Menu

See All ソフトウェア See All 計測器 See All トランスデューサ See All 振動試験装置 See All 電気音響 See All 音響エンドオブライン試験システム See All アプリケーション See All 製造業 See All キャリブレーション See All エンジニアリングサービス See All サポート See All グローバル・プレゼンス
arrow_back_ios

Main Menu

See All 解析シミュレーション See All DAQ See All APIドライバ See All ユーティリティ See All 振動コントロール See All 校正 See All DAQ See All ハンドヘルド See All 産業 See All パワーアナライザ See All シグナルコンディショナー See All 音響a See All 電流電圧 See All 変位 See All 力 See All ロードセル See All マルチコンポーネント See All 圧力 See All ひずみ See All ひずみゲージ See All 温度 See All チルト See All トルク See All 振動 See All アクセサリ See All コントローラ See All 測定加振器 See All モーダル加振器 See All パワーアンプ See All 加振器システム See All テストソリューション See All アクチュエータ See All 内燃機関 See All 耐久性 See All eDrive See All 生産テストセンサ See All トランスミッションギアボックス See All ターボチャージャ See All 音響 See All 設備とプロセスの監視 See All カスタムセンサ See All データの取得と分析 See All 耐久性および疲労 See All Electric Power Testing(電力テスト) See All NVH See All 信頼性 See All スマートセンサ See All 振動: See All 計量 See All 自動車および地上輸送 See All 圧力校正|センサー|振動子 See All 校正・修理のご依頼 See All キャリブレーションとベリフィケーション See All キャリブレーション・プラス契約 See All サポート ブリュエル・ケアー
arrow_back_ios

Main Menu

See All nCode - 耐久性および疲労解析 See All ReliaSoft - 信頼性解析と管理 See All API See All 電気音響 See All 音源探査(Noise source identification, NSI) See All 環境騒音 See All 音響パワーと音圧 See All 騒音認証 See All 産業用プロセスコントロール See All 構造ヘルスモニタリング See All 電気デバイス試験 See All 電気システム試験 See All グリッド試験 See All 高電圧試験 See All 導電加振機による振動試験 See All 構造力学 See All 機械分析と診断 See All プロセス計量 See All 車両の電動化 See All pages-not-migrated See All ソフトウェアライセンス管理

Reliability Analysis of a Storage Cluster System

This example is based on the example shown in Figure 8 of the article "Determining the Availability and Reliability of Storage Configurations" by Santosh Shetty, August 2002, as posted on Dell's website.

Example


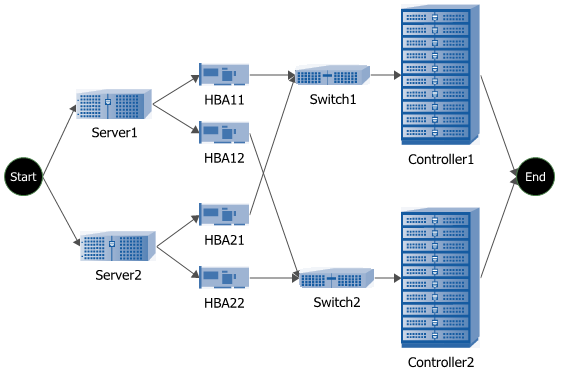
Consider a "high-availability" cluster with a reliability block diagram (RBD), as shown next.

Figure 1: Storage Cluster System

Assume the following life distributions and parameters for the components: (Note that this example, unlike the original article, assumes no repair of failed components.)


  • Server: Exponential with mean = 45,753 hours
  • Switch: Exponential with mean = 255,358 hours
  • HBA: Exponential with mean = 252,550 hours
  • Controller: Exponential with mean = 68,961 hours


The objective of the analysis is to study the reliability of the system.

Analysis


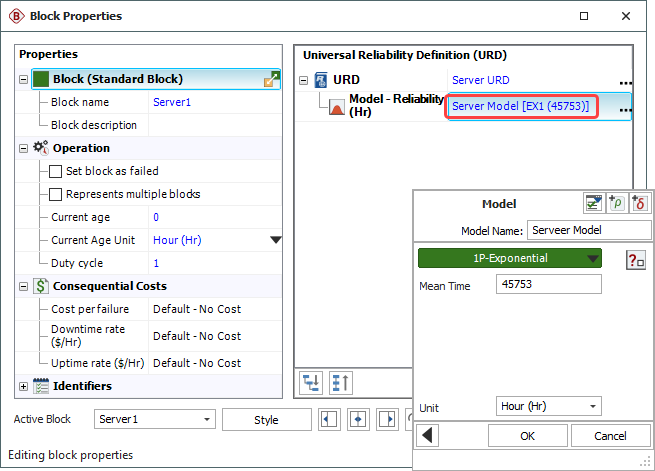
Step 1: Create the RBD of the system in BlockSim, and then use the given information to configure the universal reliability definitions (URDs) of each block. For example, the following picture shows the Block Properties window of Server1. The inset shows the Model Wizard, which allows you to define the failure model of the block. The URDs of the other blocks can be configured in a similar manner.

Figure 2: Block Properties Window of Server1 and Model Wizard (inset)

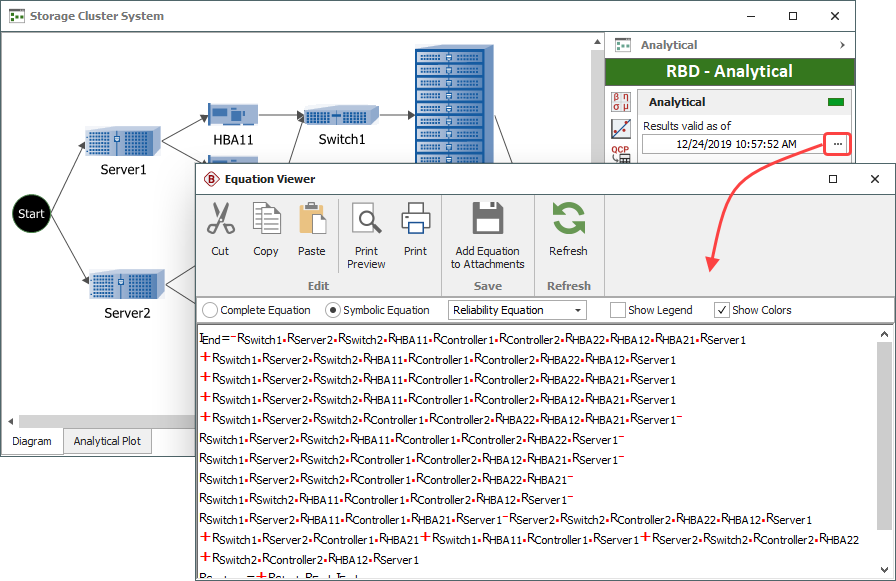
Step 2: Once the URDs have been configured, analyze the diagram and obtain the system reliability equation of the system, as shown next. In this equation, each R is the reliability (1-cdf) function of the item. As an example, RServer2 is the reliability function of Server 2.

Figure 3: System Reliability Equation of the Storage Cluster System

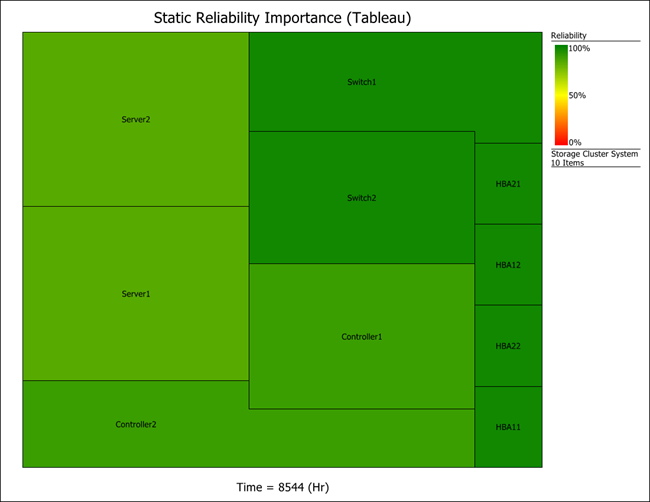
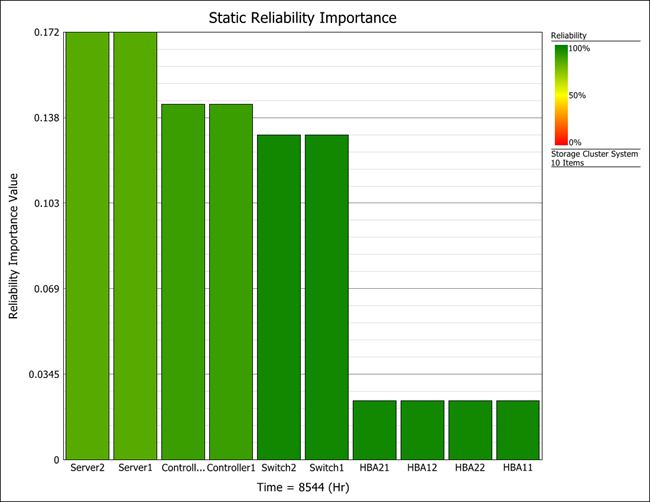
Step 3: Generate system level plots to see more information about the system. The next two charts are component reliability importance plots at t = 8544 hr. Both plots (a tableau area plot and a bar chart) illustrate the same concept; that is, the higher the importance of the component, the higher its effect on system reliability.

Figure 4: Static Reliability Importance - Tableau Area Chart
Figure 5: Static Reliability Importance - Bar Chart

As you can see, the servers in this configuration are the most critical component, while the hubs are the least critical.


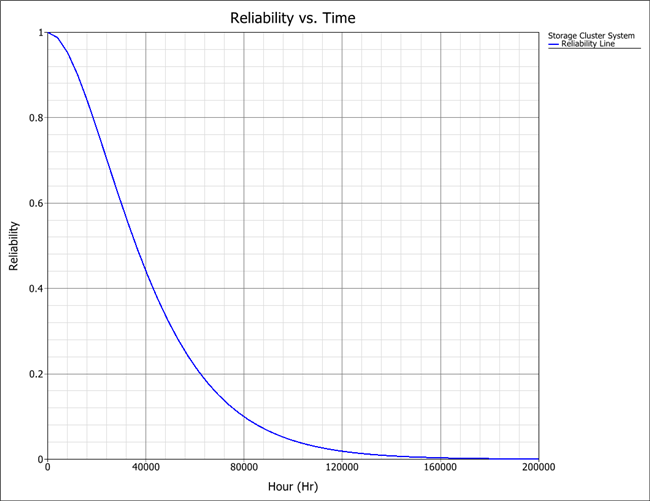
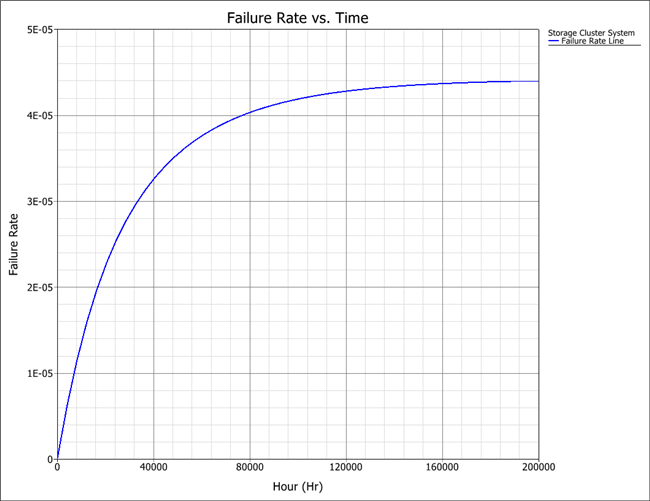
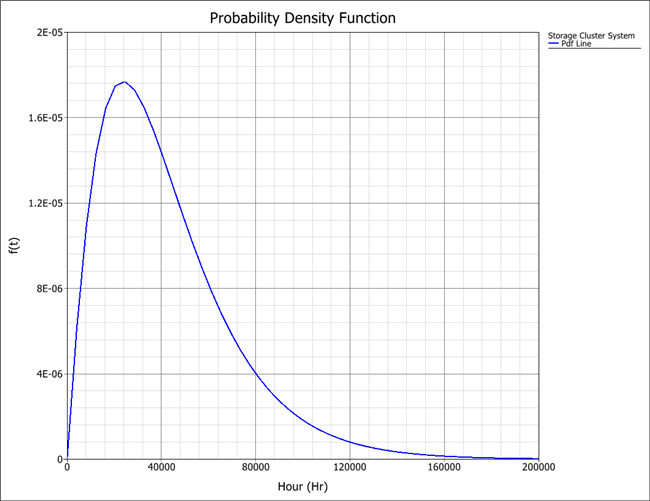
The following pictures show additional plots.

Figure 6: RI vs. Time Plot
Figure 7: System Reliability Plot
Figure 8: System Failure Rate Plot
Figure 9: System pdf plot

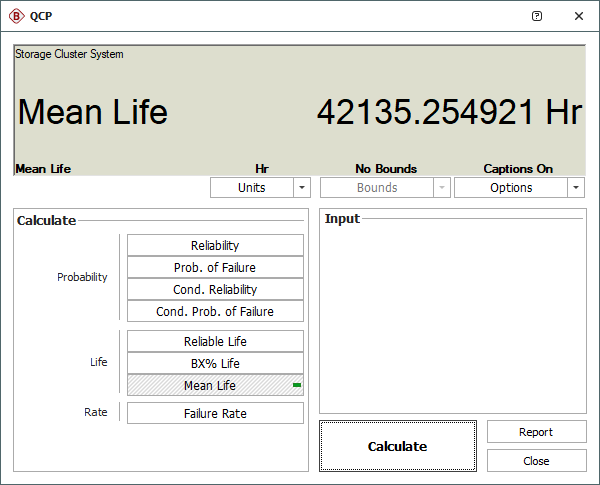
Step 4: Use BlockSim's Analytical Quick Calculation Pad (QCP) to obtain some of the most frequently requested reliability results. For example, the MTTF (mean time to failure) of the system is about 42,135 hours, as shown next.

Figure 10: Analytical QCP