arrow_back_ios

Main Menu

See All ソフトウェア See All 計測器 See All トランスデューサ See All 振動試験装置 See All 電気音響 See All 音響エンドオブライン試験システム See All アプリケーション See All 製造業 See All キャリブレーション See All エンジニアリングサービス See All サポート See All グローバル・プレゼンス
arrow_back_ios

Main Menu

See All 解析シミュレーション See All DAQ See All APIドライバ See All ユーティリティ See All 振動コントロール See All 校正 See All DAQ See All ハンドヘルド See All 産業 See All パワーアナライザ See All シグナルコンディショナー See All 音響a See All 電流電圧 See All 変位 See All 力 See All ロードセル See All マルチコンポーネント See All 圧力 See All ひずみ See All ひずみゲージ See All 温度 See All チルト See All トルク See All 振動 See All アクセサリ See All コントローラ See All 測定加振器 See All モーダル加振器 See All パワーアンプ See All 加振器システム See All テストソリューション See All アクチュエータ See All 内燃機関 See All 耐久性 See All eDrive See All 生産テストセンサ See All トランスミッションギアボックス See All ターボチャージャ See All 音響 See All 設備とプロセスの監視 See All カスタムセンサ See All データの取得と分析 See All 耐久性および疲労 See All Electric Power Testing(電力テスト) See All NVH See All 信頼性 See All スマートセンサ See All 振動: See All 計量 See All 自動車および地上輸送 See All 圧力校正|センサー|振動子 See All 校正・修理のご依頼 See All キャリブレーションとベリフィケーション See All キャリブレーション・プラス契約 See All サポート ブリュエル・ケアー
arrow_back_ios

Main Menu

See All nCode - 耐久性および疲労解析 See All ReliaSoft - 信頼性解析と管理 See All API See All 電気音響 See All 音源探査(Noise source identification, NSI) See All 環境騒音 See All 音響パワーと音圧 See All 騒音認証 See All 産業用プロセスコントロール See All 構造ヘルスモニタリング See All 電気デバイス試験 See All 電気システム試験 See All グリッド試験 See All 高電圧試験 See All 導電加振機による振動試験 See All 構造力学 See All 機械分析と診断 See All プロセス計量 See All 車両の電動化 See All pages-not-migrated See All ソフトウェアライセンス管理
img

expand_more
chevron_left
chevron_right

Accelerated Life Testing - Demonstrating the B10 Life

The accelerating stress for an electronic component is temperature. To meet the specified reliability requirement, the manufacturer is required to demonstrate with 90% confidence that 90% of the units will continue to operate for 1,000 hours under normal use conditions of 300 K. To save time and money, the manufacturer develops an accelerated life test designed to provide the desired reliability results in a shorter period of time than would be possible with a test performed under normal stress conditions.

Experiment and data


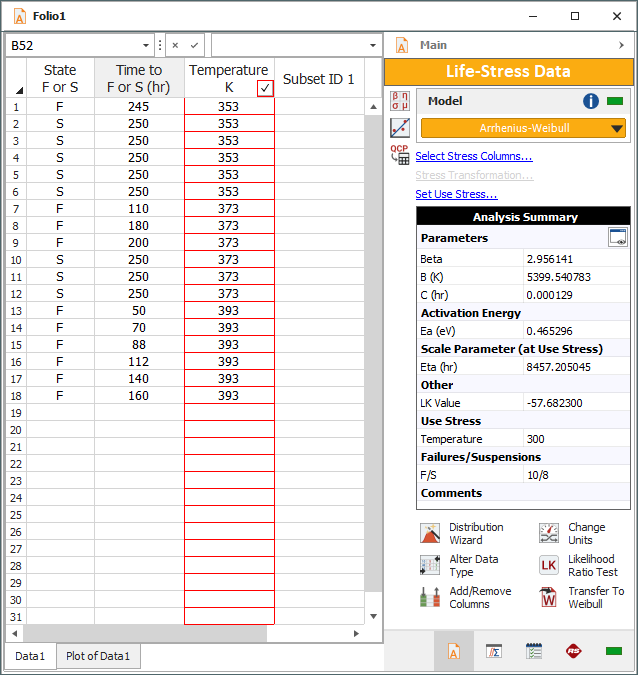
A sample of units are put to an accelerated life test with three different stress levels: 353 K, 373 K and 393 K. The failure times obtained during this test are presented in the table shown next.

This information can be used to determine the following:
a) What is the activation energy?
b) Is the B10 life of 1,000 hours at a 90% lower 1-sided confidence for the use stress level (300 K) demonstrated by the test?
c) Plot the acceleration factor vs. stress for this accelerated life test.
d) Assuming that 1,000 units will be sold each month, determine the expected number of failures over the next six months so that an appropriate stock of spare parts can be kept on hand.

Analysis


Step 1: Using Accelerated Life Testing or Accelerated Life Testing (PRO), the analyst creates a standard folio for failure and suspension times with one stress column for temperature (in kelvins, K), with a use stress level of 300 K. The data set is analyzed in Weibull++ using a combination of the Arrhenius model and the Weibull distribution. The results show an activation energy (Ea) = 0.465299, as shown next.

Figure 1: Calculated results from the simple accelerated demonstration test

Step 2: Once the parameters have been calculated, a variety of plots, results and reports can be obtained.


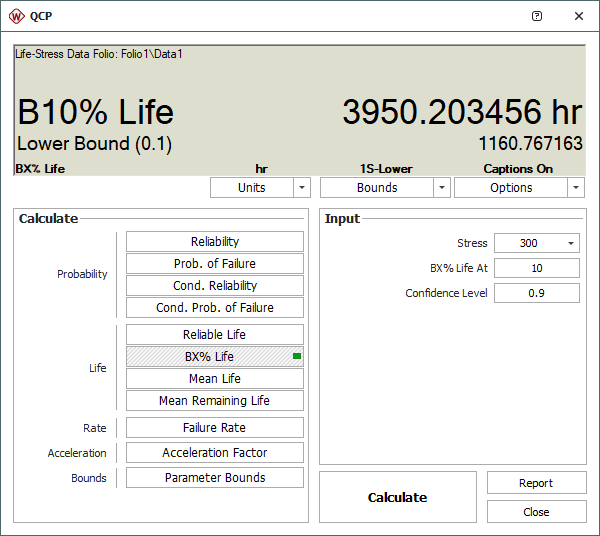
B10 Life: The QCP can be used to calculate the B10 life with the specified confidence bounds, as shown next.

Figure 2: The calculated B10 life with 90% lower one-sided confidence bounds

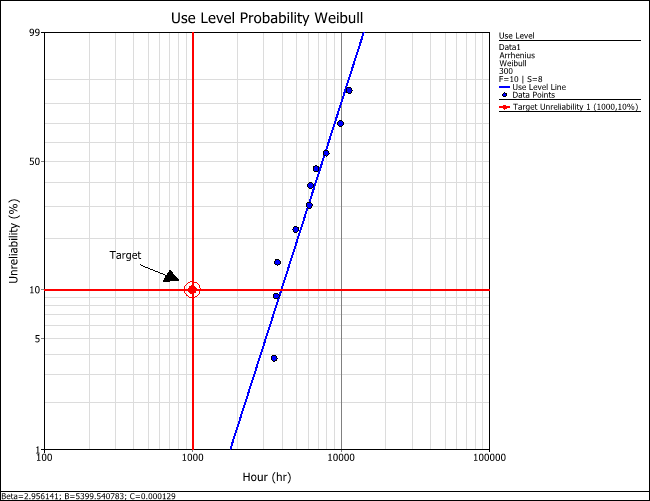
The B10 life demonstrated at the 90% lower 1-sided confidence is found to be 1,161 hours, well above the required 1,000 hours. You can also confirm that the product meets the target metric by marking the B10 target on a probability plot, as shown next (with the scaling adjusted to Y= 1 to 99 and X= 100 to 10,000).

Figure 3: Determining the B10 life demonstrated by the test from the use level Weibull probability plot

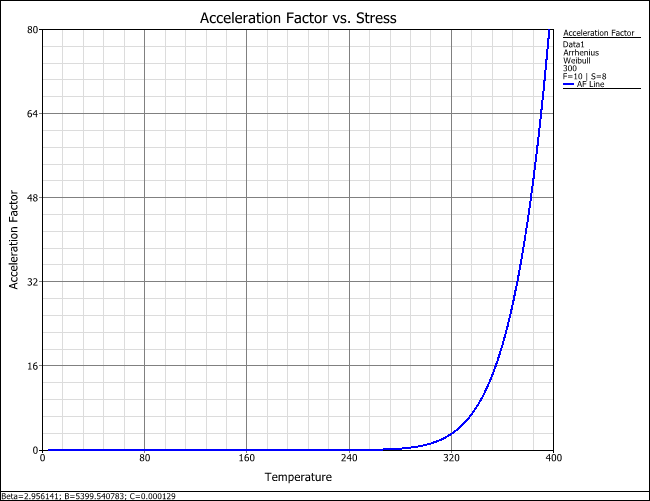
An Acceleration Factor vs. Stress plot is shown next (with the scaling adjusted to Y= 0 to 80 and X= 200 to 400).

Figure 4: Acceleration Factor vs. Stress plot for the accelerated demonstration test data analysis

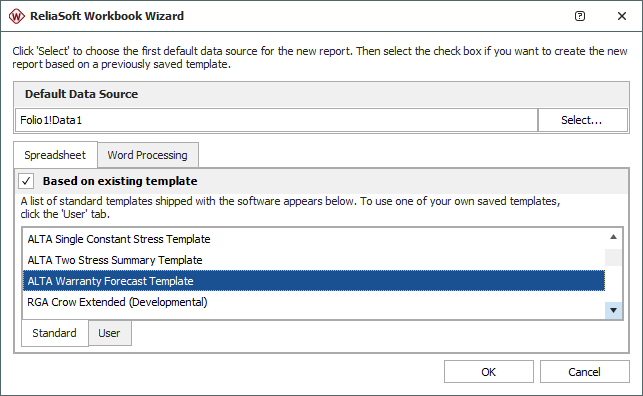
Expected Number of Failures: The analyst creates a ReliaSoft Workbook report using the data from the calculated standard folio and based on the "ALTA Warranty Forecast Template".

Figure 5: Setting up a new ReliaSoft Workbook

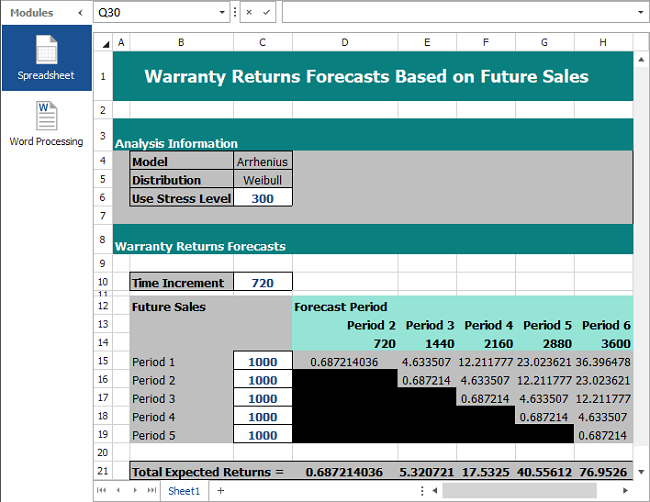
Then the following inputs are entered into the spreadsheet module of the ReliaSoft Workbook:

  • Use Stress Level: 300
  • Time Increment: 720 (24 hours/day * 30 days/month = 720 hours/month)
  • Future Sales (in the Warranty Returns Forecasts area) for Periods 1-5: 1,000


The final report is shown next.

Figure 6: Report using the data from the calculated standard folio and based on the "ALTA Warranty Forecast Template"