arrow_back_ios

Main Menu

See All ソフトウェア See All 計測器 See All トランスデューサ See All 振動試験装置 See All 電気音響 See All 音響エンドオブライン試験システム See All アプリケーション See All 各産業 See All キャリブレーション See All エンジニアリングサービス See All サポート See All グローバル・プレゼンス
arrow_back_ios

Main Menu

See All 解析シミュレーション See All DAQ See All APIドライバ See All ユーティリティ See All 振動コントロール See All 校正 See All DAQ See All ハンドヘルド See All 産業 See All パワーアナライザ See All シグナルコンディショナー See All 音響a See All 電流電圧 See All 変位 See All 力 See All ロードセル See All マルチコンポーネント See All 圧力 See All ひずみ See All ひずみゲージ See All 温度 See All チルト See All トルク See All 振動 See All アクセサリ See All コントローラ See All 測定加振器 See All モーダル加振器 See All パワーアンプ See All 加振器システム See All テストソリューション See All アクチュエータ See All 内燃機関 See All 耐久性 See All eDrive See All 生産テストセンサ See All トランスミッションギアボックス See All ターボチャージャ See All 音響 See All 設備とプロセスの監視 See All カスタムセンサ See All データの取得と分析 See All 耐久性および疲労 See All Electric Power Testing(電力テスト) See All NVH See All 信頼性 See All スマートセンサ See All 振動: See All 計量 See All 自動車および地上輸送 See All 圧力校正|センサー|振動子 See All 校正・修理のご依頼 See All キャリブレーションとベリフィケーション See All キャリブレーション・プラス契約 See All サポート ブリュエル・ケアー
arrow_back_ios

Main Menu

See All nCode - 耐久性および疲労解析 See All ReliaSoft - 信頼性解析と管理 See All API See All 電気音響 See All 音源探査(Noise source identification, NSI) See All 環境騒音 See All 音響パワーと音圧 See All 騒音認証 See All 産業用プロセスコントロール See All 構造ヘルスモニタリング See All 電気デバイス試験 See All 電気システム試験 See All グリッド試験 See All 高電圧試験 See All 導電加振機による振動試験 See All 構造力学 See All 機械分析と診断 See All プロセス計量 See All 車両の電動化 See All pages-not-migrated See All ソフトウェアライセンス管理
img

expand_more
chevron_left
chevron_right

信頼性向上モジュール

Reliability Growth analysis models


Reliability Growth module supports all of the traditional reliability growth analysis models, such as Crow-AMSAA (NHPP), Duane, Standard and Modified Gompertz, Lloyd-Lipow and Logistic.

Reliability growth data types


Times-to-failure data


When you have data from developmental testing in which the systems were operated continuously until failure, you can use the Crow-AMSAA (NHPP) or Duane models. The module provides a choice of data types for individual or grouped failure times, and for combining data from multiple identical systems. This can include situations, where all systems operate concurrently, you have recorded the exact operating times for both the failed and non-failed systems or you have recorded the calendar date for each failure so you can estimate the operating times of the non-failed systems based on the average daily usage rate for the relevant time period.

With the Crow-AMSAA (NHPP) model, there are additional analysis options for certain situations, such as Gap analysis (if you believe that some portion of the data is erroneous or missing) or change of slope (if a major change in the system design or operational environment has caused a significant change in the failure intensity observed during testing).


Discrete data (also called attribute, one-shot or success/failure data)


When you have data from one-shot (pass/fail) reliability growth tests (and depending on the data type), the module supports mixed data models that can be used with Crow Extended and Crow Extended-Continuous Evaluation models. For discrete data, there is a choice of data types that can handle tests in which a single trial is performed for each design configuration, multiple trials per configuration, or a combination of both. The module also supports Failure Discounting, if you have recorded the specific failure modes from sequential one-shot tests.


Reliability data


When you simply wish to analyze the calculated reliability values for different times/stages within developmental testing, you can use the Standard Gompertz, Modified Gompertz, Lloyd-Lipow or Logistic models.


Reliability Growth projections, planning and management


Reliability Growth module supports several innovative approaches that expand upon traditional reliability growth methods in ways that better represent real-world testing practices and practical applications.

  • The Crow Extended model allows you to classify failure modes based on whether and when they will be fixed. This allows you to make reliability growth projections and evaluate the reliability growth management strategy.
  • The Growth Planning Folio helps you to create a multi-phase reliability growth testing plan. In addition, you can use the Crow Extended – Continuous Evaluation model to analyze data from multiple test phases and create a Multi-Phase Plot to compare your test results against the plan. This will help to determine if it is necessary to make adjustments in subsequent test phases in order to meet your reliability goals.
  • The Discrete Reliability Growth Planning folio allows you to develop the overall strategy for one-shot devices.
  • The Mission Profile Folio helps you create a balanced operational test plan and track the actual testing against the plan to make sure the data will be suitable for reliability growth analysis.
  • An MIL-HDBK-189 planning model is available in the Continuous Growth Planning folio.

Reliability growth analysis results, plots and reports


For traditional reliability growth analysis, you can calculate the MTBF, failure intensity or reliability for a given time/stage. You can determine the amount of testing that will be required to demonstrate a specified MTBF, failure intensity or reliability. Additionally, you can estimate the expected number of failures for a given time/stage. The module makes it easy to create a complete array of plots and charts to present your analysis graphically.

Failure mode classifications and effectiveness factors


Although traditional reliability growth analysis requires the assumption that all design improvements are incorporated before the end of the test (test-fix-test), many real-world testing scenarios may also include some failure modes that are not fixed, and others where some or all of the fixes are delayed until a later time (test-fix-find-test or test-find-test). With the Crow Extended and Crow Extended – Continuous Evaluation models, you can use Failure Mode Classifications to provide the appropriate analysis treatment for any of these management strategies. For delayed fixes, both models use Effectiveness Factors to indicate how much the failure intensity of each mode will be reduced once the fix has been implemented.

Fielded repairable system analysis


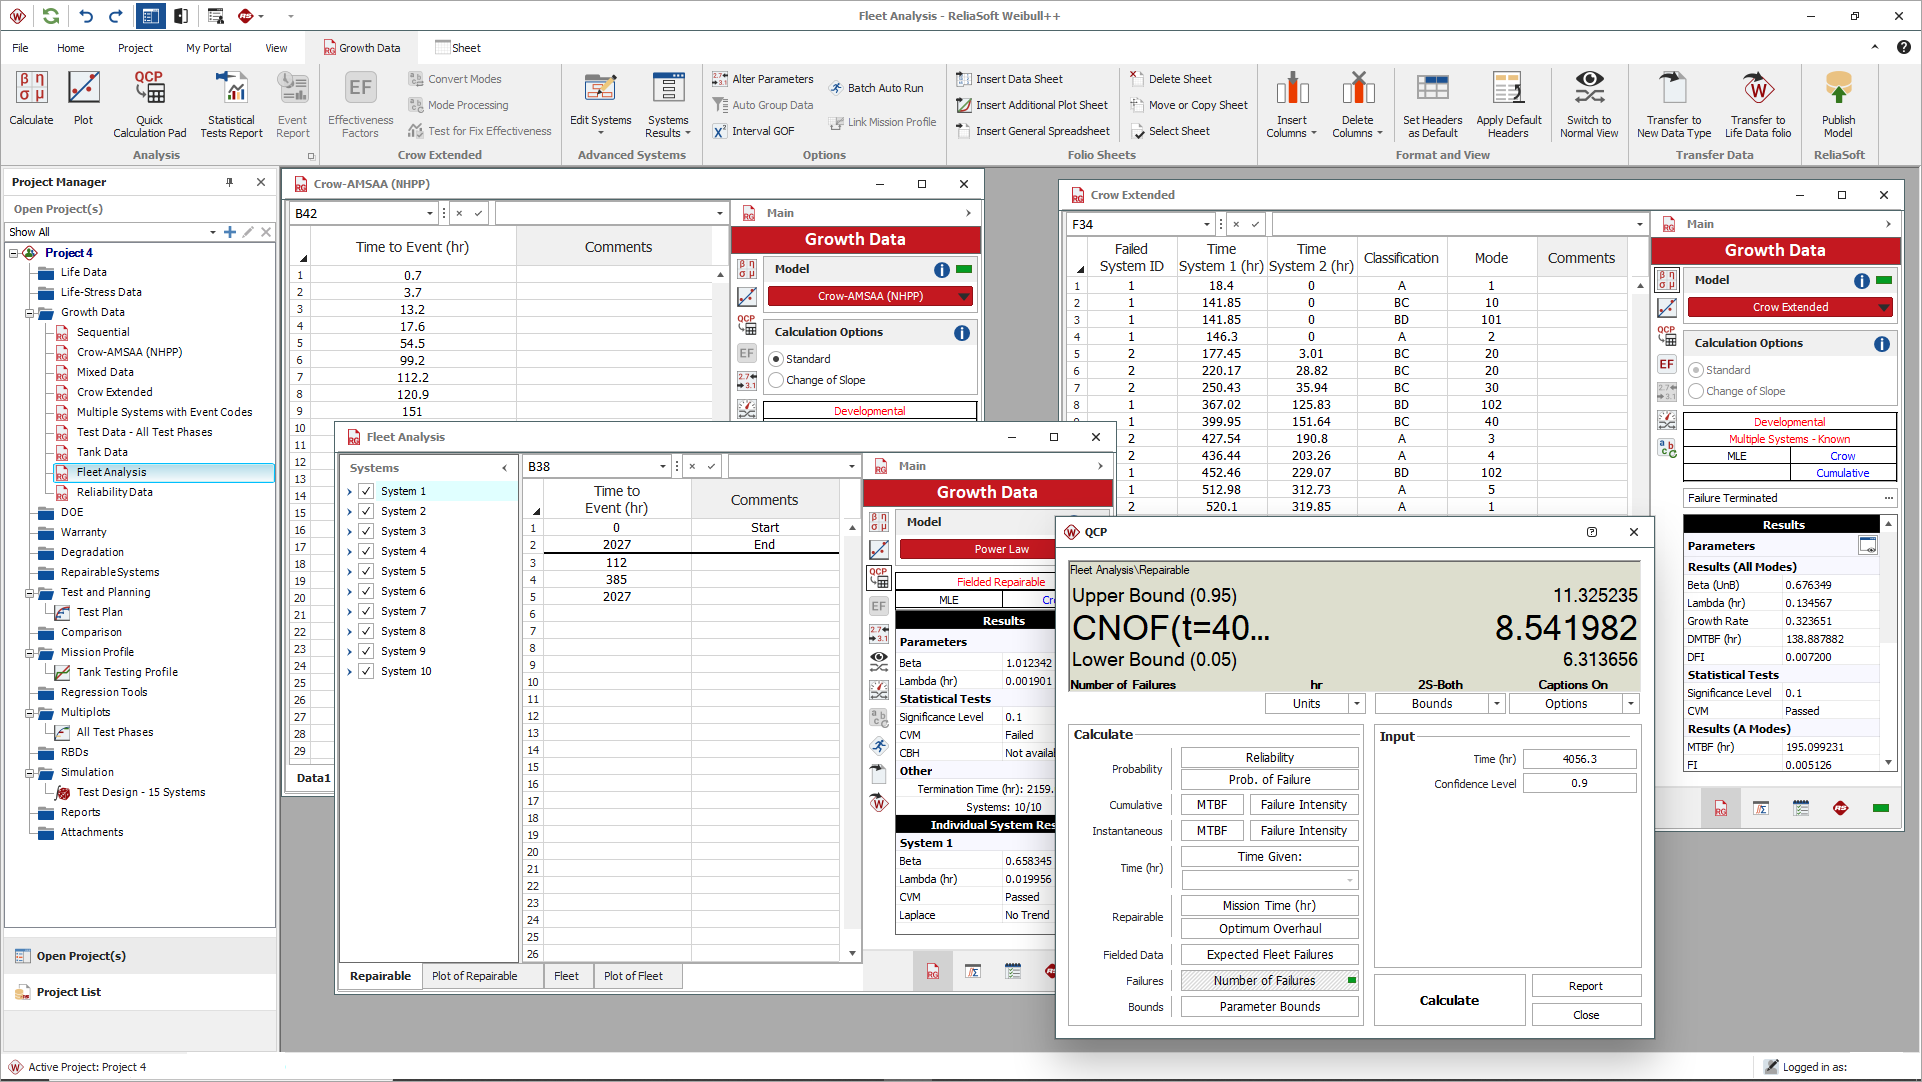
The Reliability Growth module provides opportunities for fielded repairable system analysis. Repairable systems analysis to analyze data from repairable systems operating in the field under typical customer usage conditions. Such data might be obtained from a warranty system, repair depot, operational testing, etc. Specifically, you can use the Power Law or Crow-AMSAA (NHPP) models for repairable system analysis based on the assumption of minimal repair (i.e., the system is "as bad as old" after each repair) to calculate a variety of useful metrics, including:

  • Optimum overhaul time for a given repair cost and overhaul cost
  • Conditional reliability, MTBF or failure intensity for a given time
  • Expected number of failures for a given time
  • Time for a given conditional reliability, MTBF or failure intensity
  • Expected fleet failures calculation for the number of failures that are expected to occur for all systems by a specified time

You can also use the Crow Extended model for fielded repairable systems if you want to evaluate the improvement (i.e., the jump in MTBF) that could be achieved by rolling out a set of fixes for all systems operating in the field.

Reliability test design for repairable systems uses the NHPP model to determine the test time required per system (or the number of systems that must be tested) in order to demonstrate a specified reliability goal, defined in terms of MTBF or failure intensity at a given time. 

Operational mission profiles to make sure that the testing is applied in a balanced manner that will yield data suitable for reliability growth analysis. Mission Profile folios can help you to create an operational test plan, track the expected vs. actual usage for all mission profiles and verify that the testing has been conducted. It helps you automatically group the data at specified "convergence points" so the growth model can be applied appropriately.

Monte Carlo simulation


Create data sets that can be analyzed directly in one of the Reliability Growth’s standard folios. You can also use the SimuMatic® utility to automatically analyze and plot results from a large number of data sets that have been created via simulation. These integrated simulation tools can be used to perform a wide variety of reliability tasks, such as: 

  • Designing reliability growth tests.
  • Obtaining simulation-based confidence bounds.
  • Experimenting with the influences of sample sizes and data types on analysis methods.
  • Evaluating the impact of allocated test time.